This is part of The MDEdTribune's series on Maryland's 2025-26 enrollment data.
Every September, a new kindergarten class walks through the doors of Maryland's public schools. Every September for four straight years, that class has been smaller than the one before it.
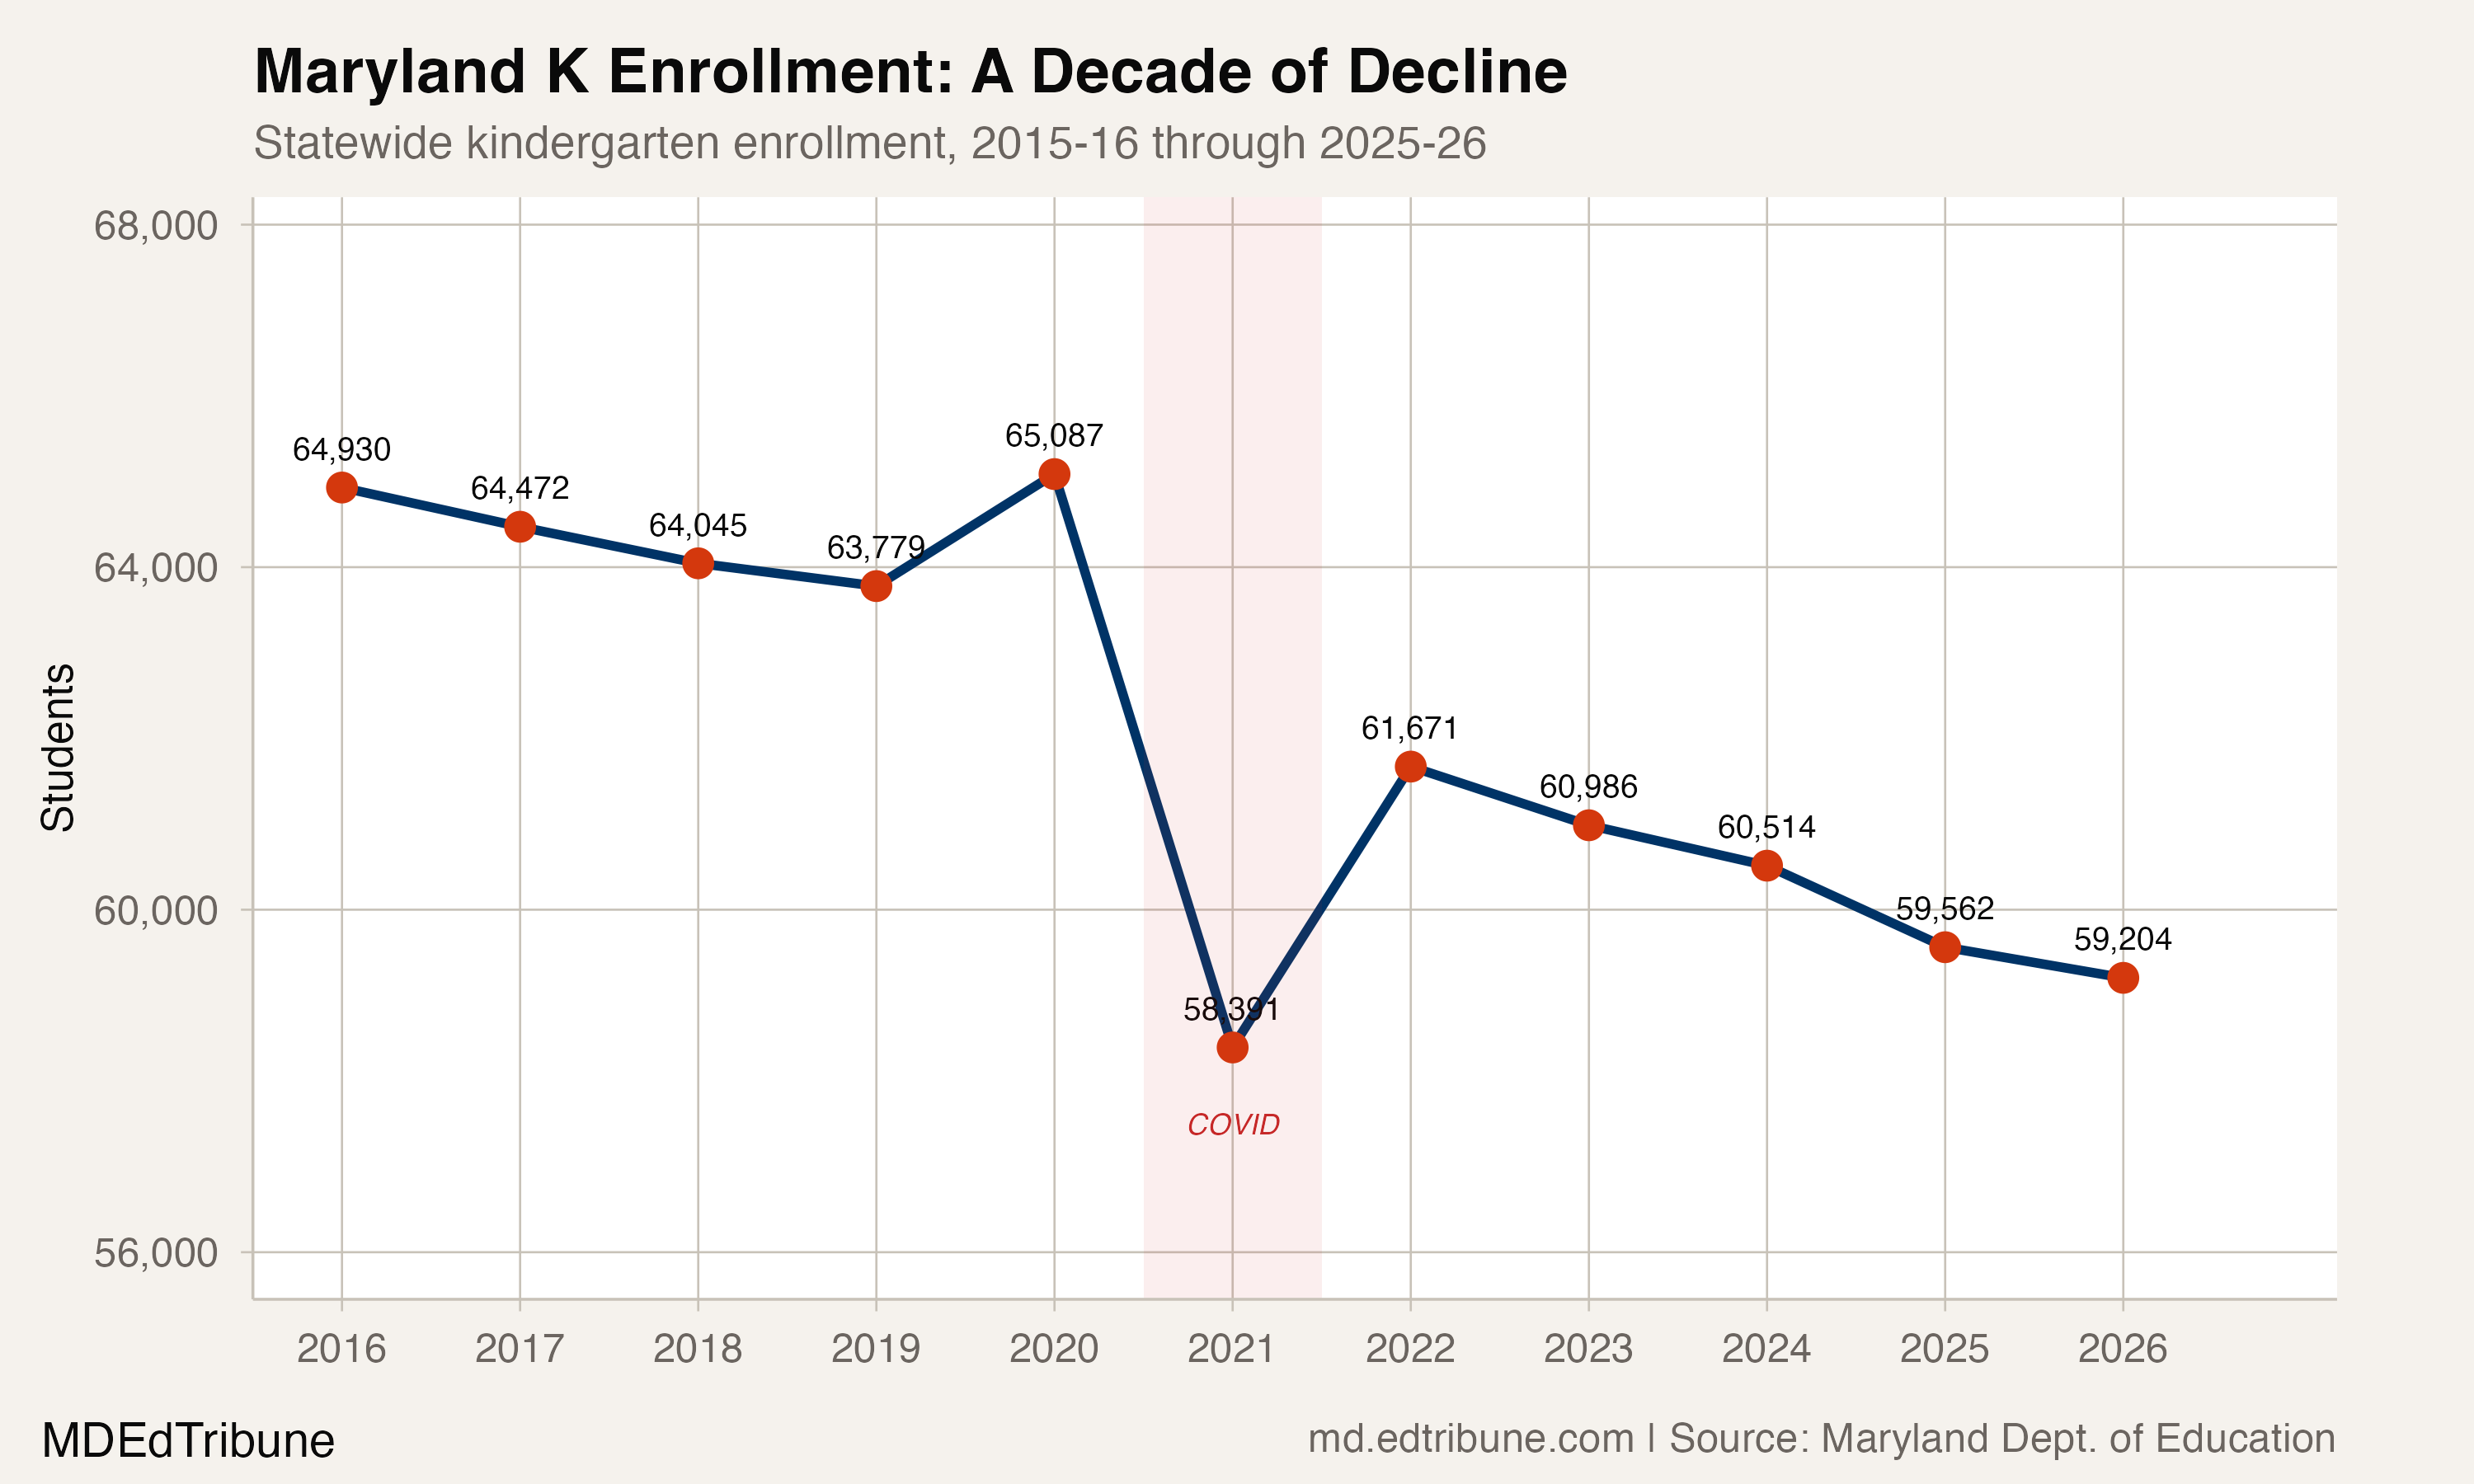
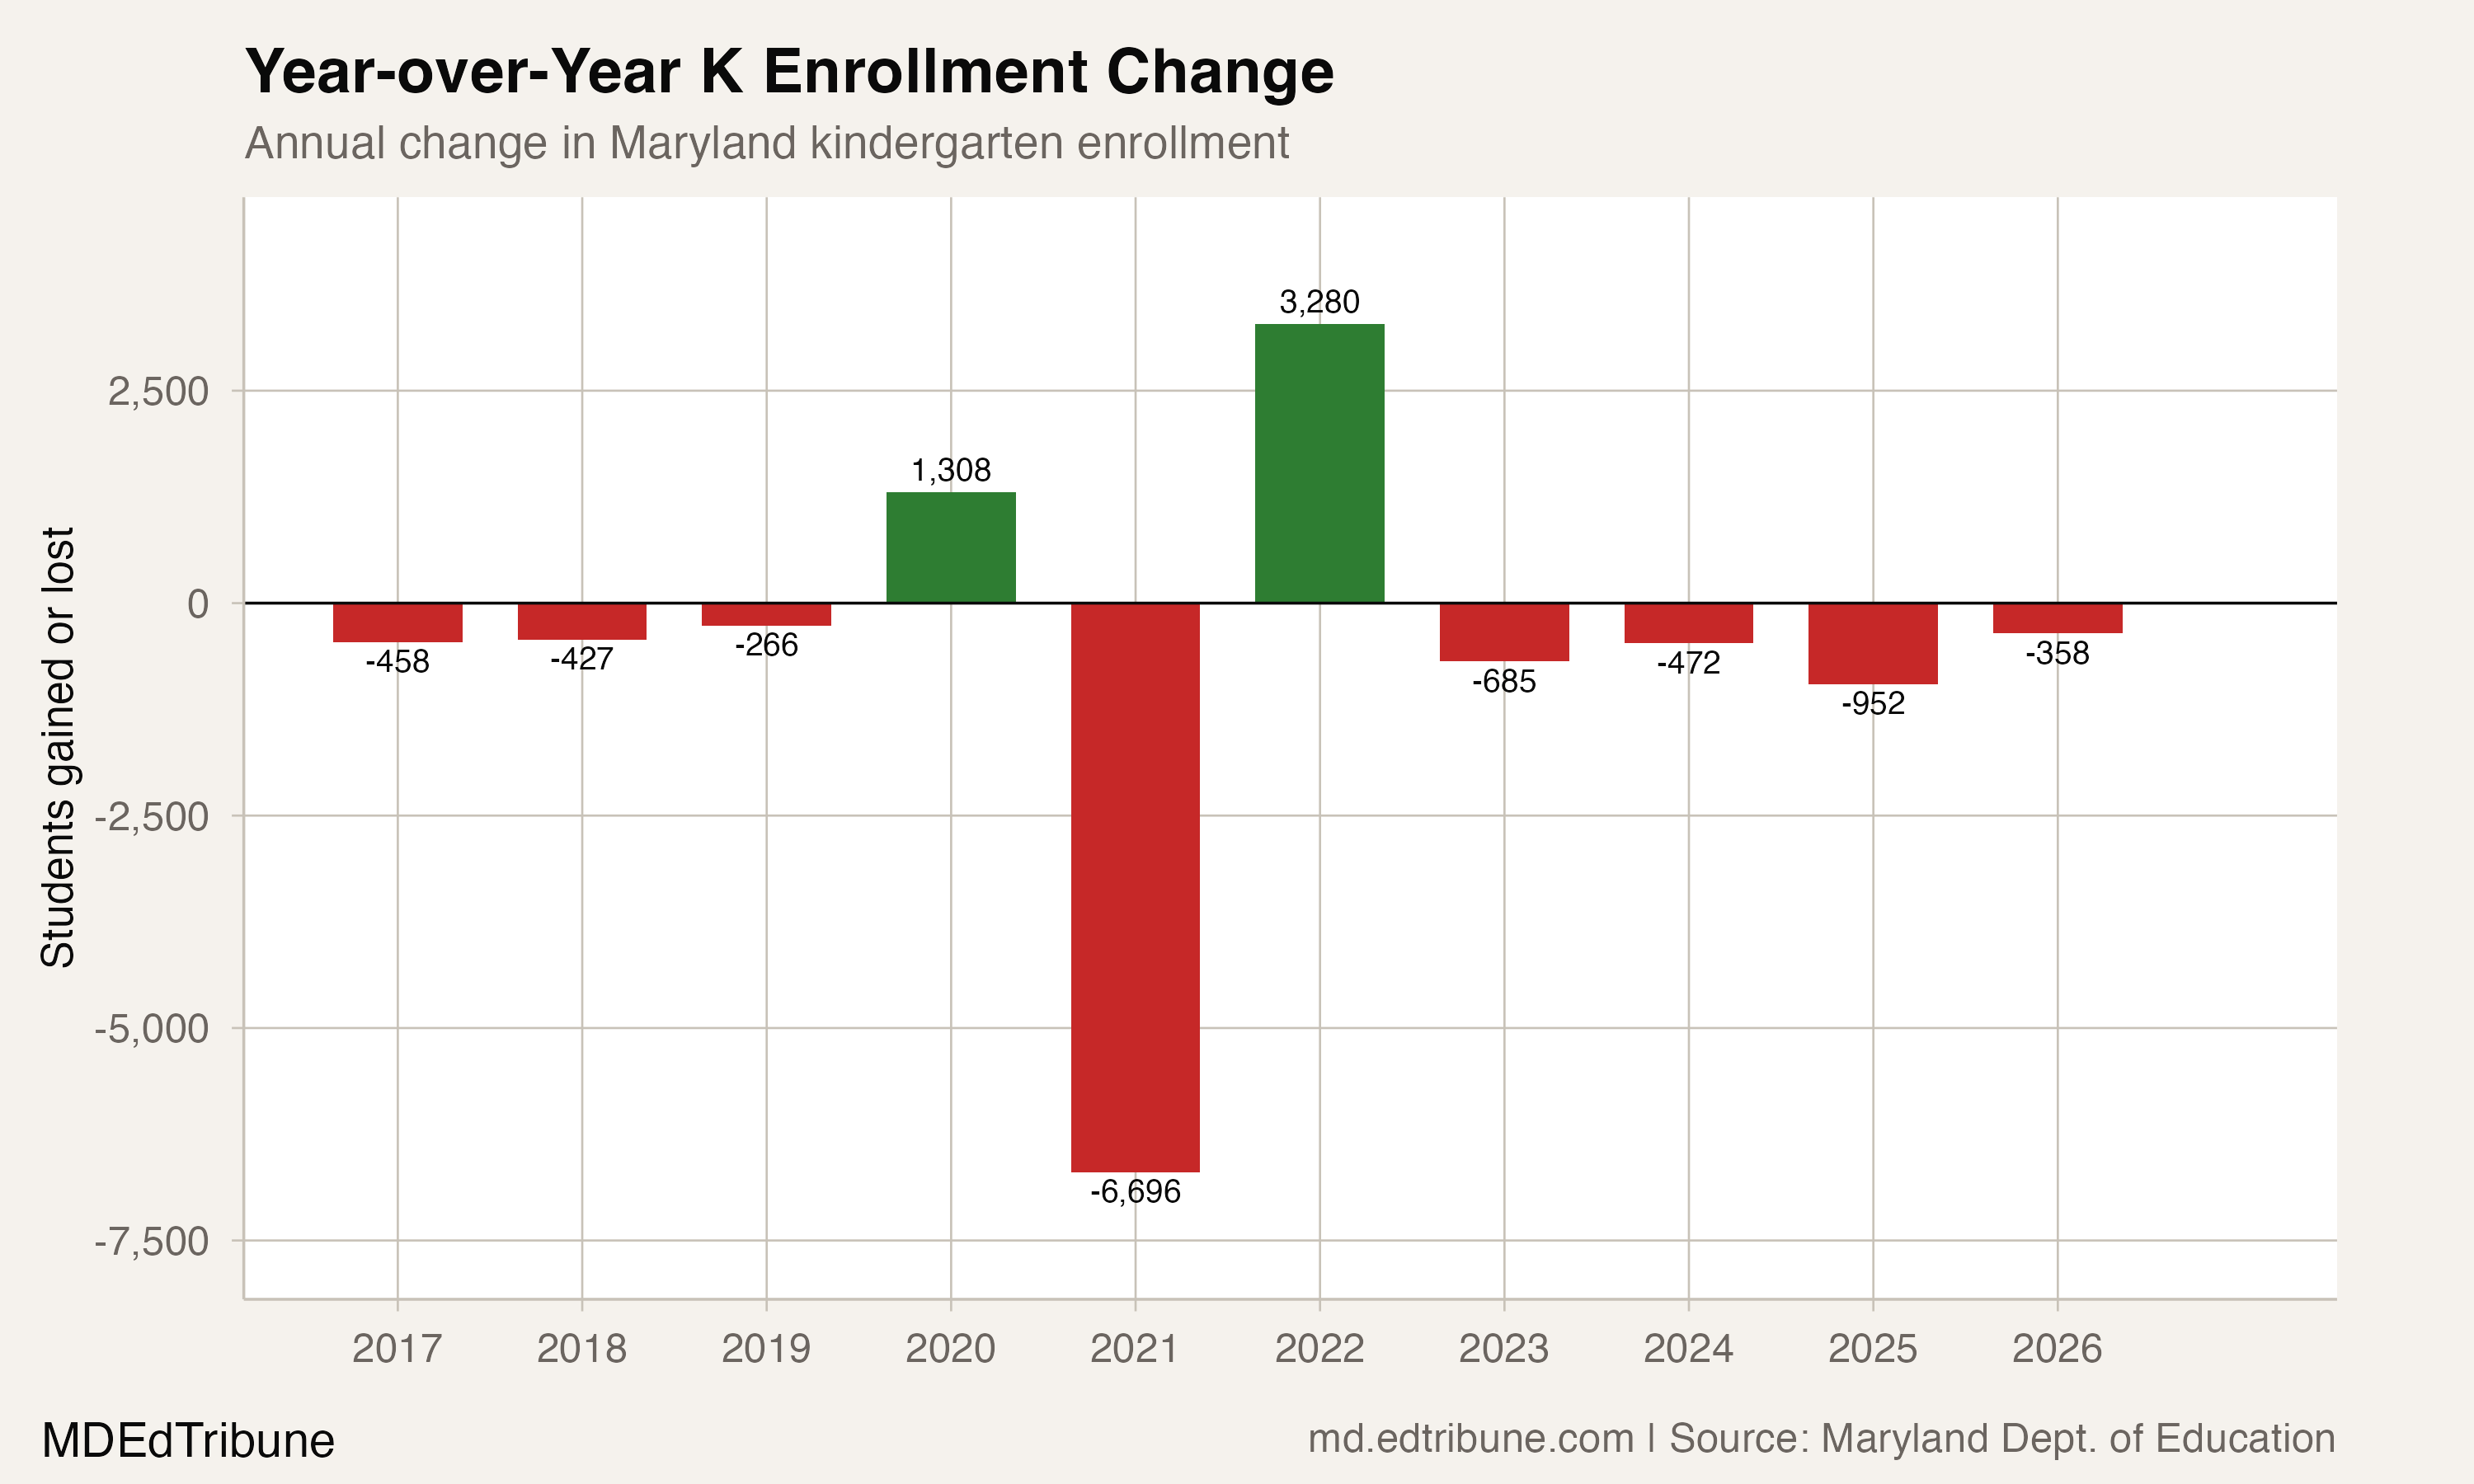
Maryland enrolled 59,204 kindergartners in 2025-26, down 8.8% from the 64,930 who started school a decade ago. The decline was not sudden. Before COVID-19, K enrollment had been drifting lower for three consecutive years. The pandemic's 10.3% crash in 2020-21 briefly masked the underlying trend, and the partial bounce in 2021-22 briefly suggested recovery. It was not recovery. Since that bounce, kindergarten enrollment has dropped every single year, shedding another 2,467 students. Twenty of Maryland's 24 school systems now enroll fewer kindergartners than they did before the pandemic.
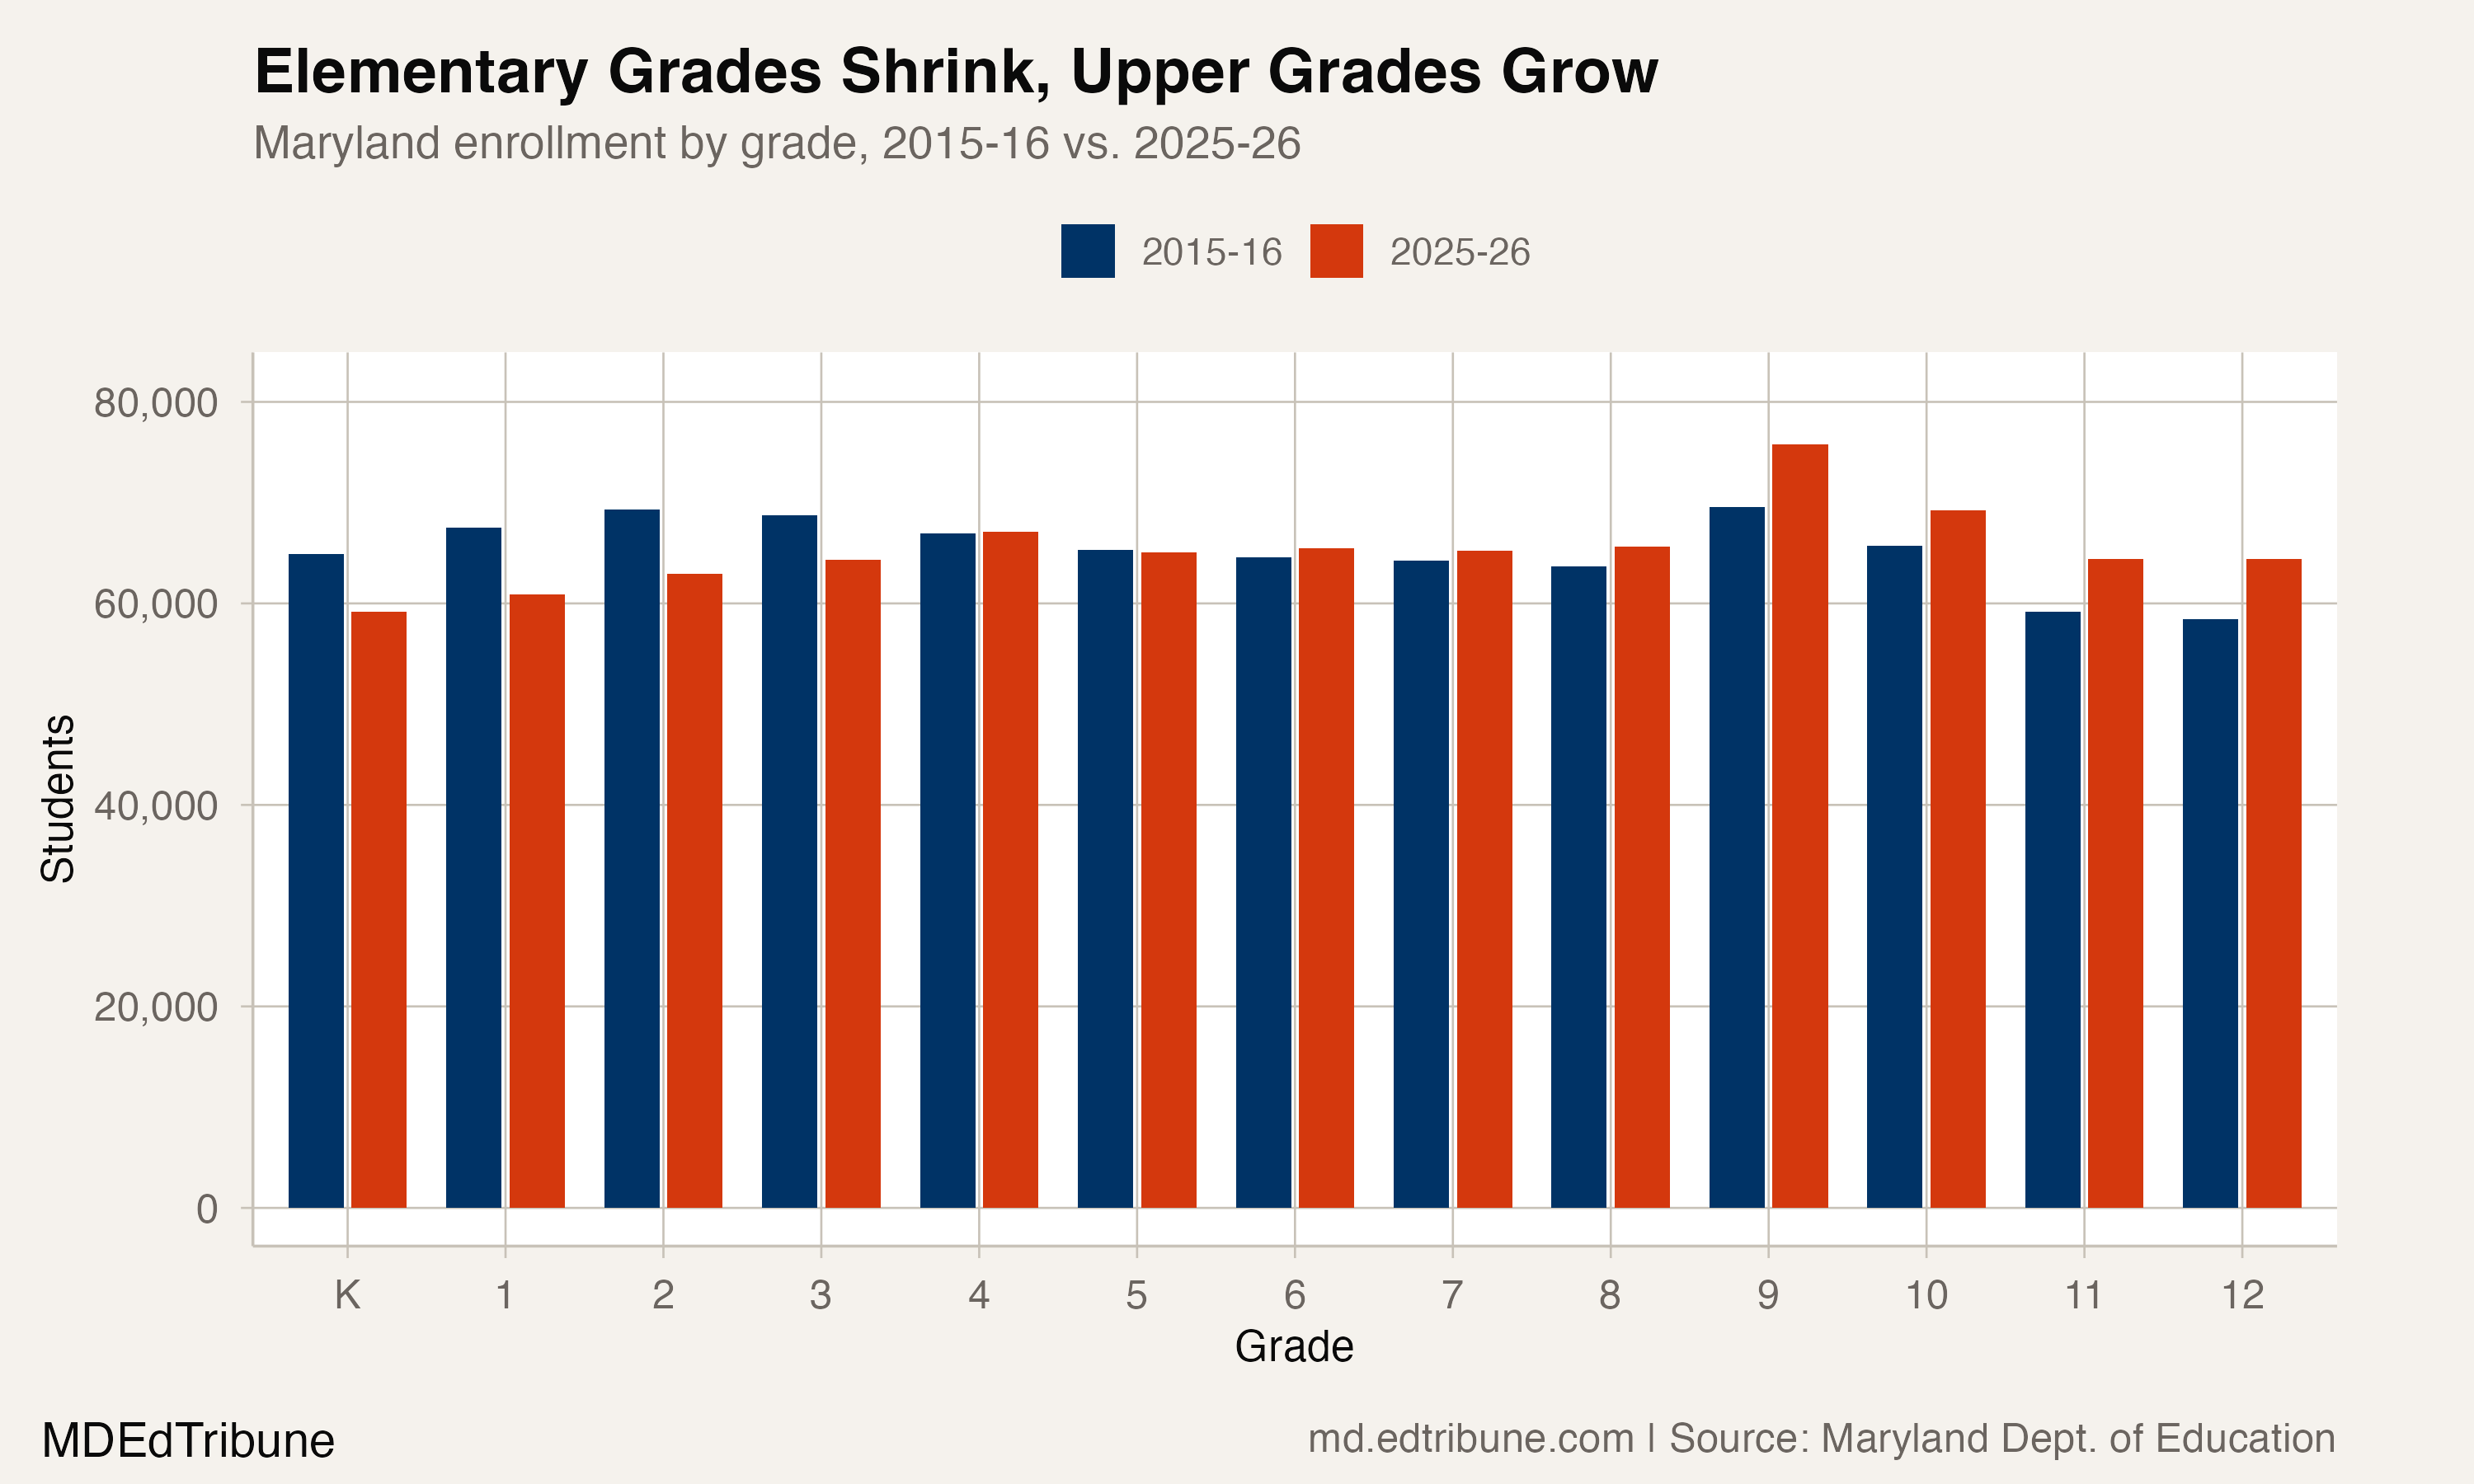
The size of a kindergarten class is not just a data point about five-year-olds. It is a forecast. Each small cohort ripples forward through elementary school, then middle school, then high school, locking in 12 years of smaller classes. Maryland's elementary grades are already feeling it: grades K through 3 have all shrunk between 6.5% and 9.7% since 2015-16, while high school grades have grown 5.4% to 10.1% over the same period. The system is top-heavy, and the pipeline feeding it is narrowing.
Fewer births, fewer kindergartners
The most direct explanation is demographic. Maryland births have declined steadily, from more than 77,000 per year in 2007-2008 to roughly 65,600 in 2023-24. Those children born in the mid-2000s are now graduating high school. The children born in the leaner years since 2019 are the ones entering kindergarten now.
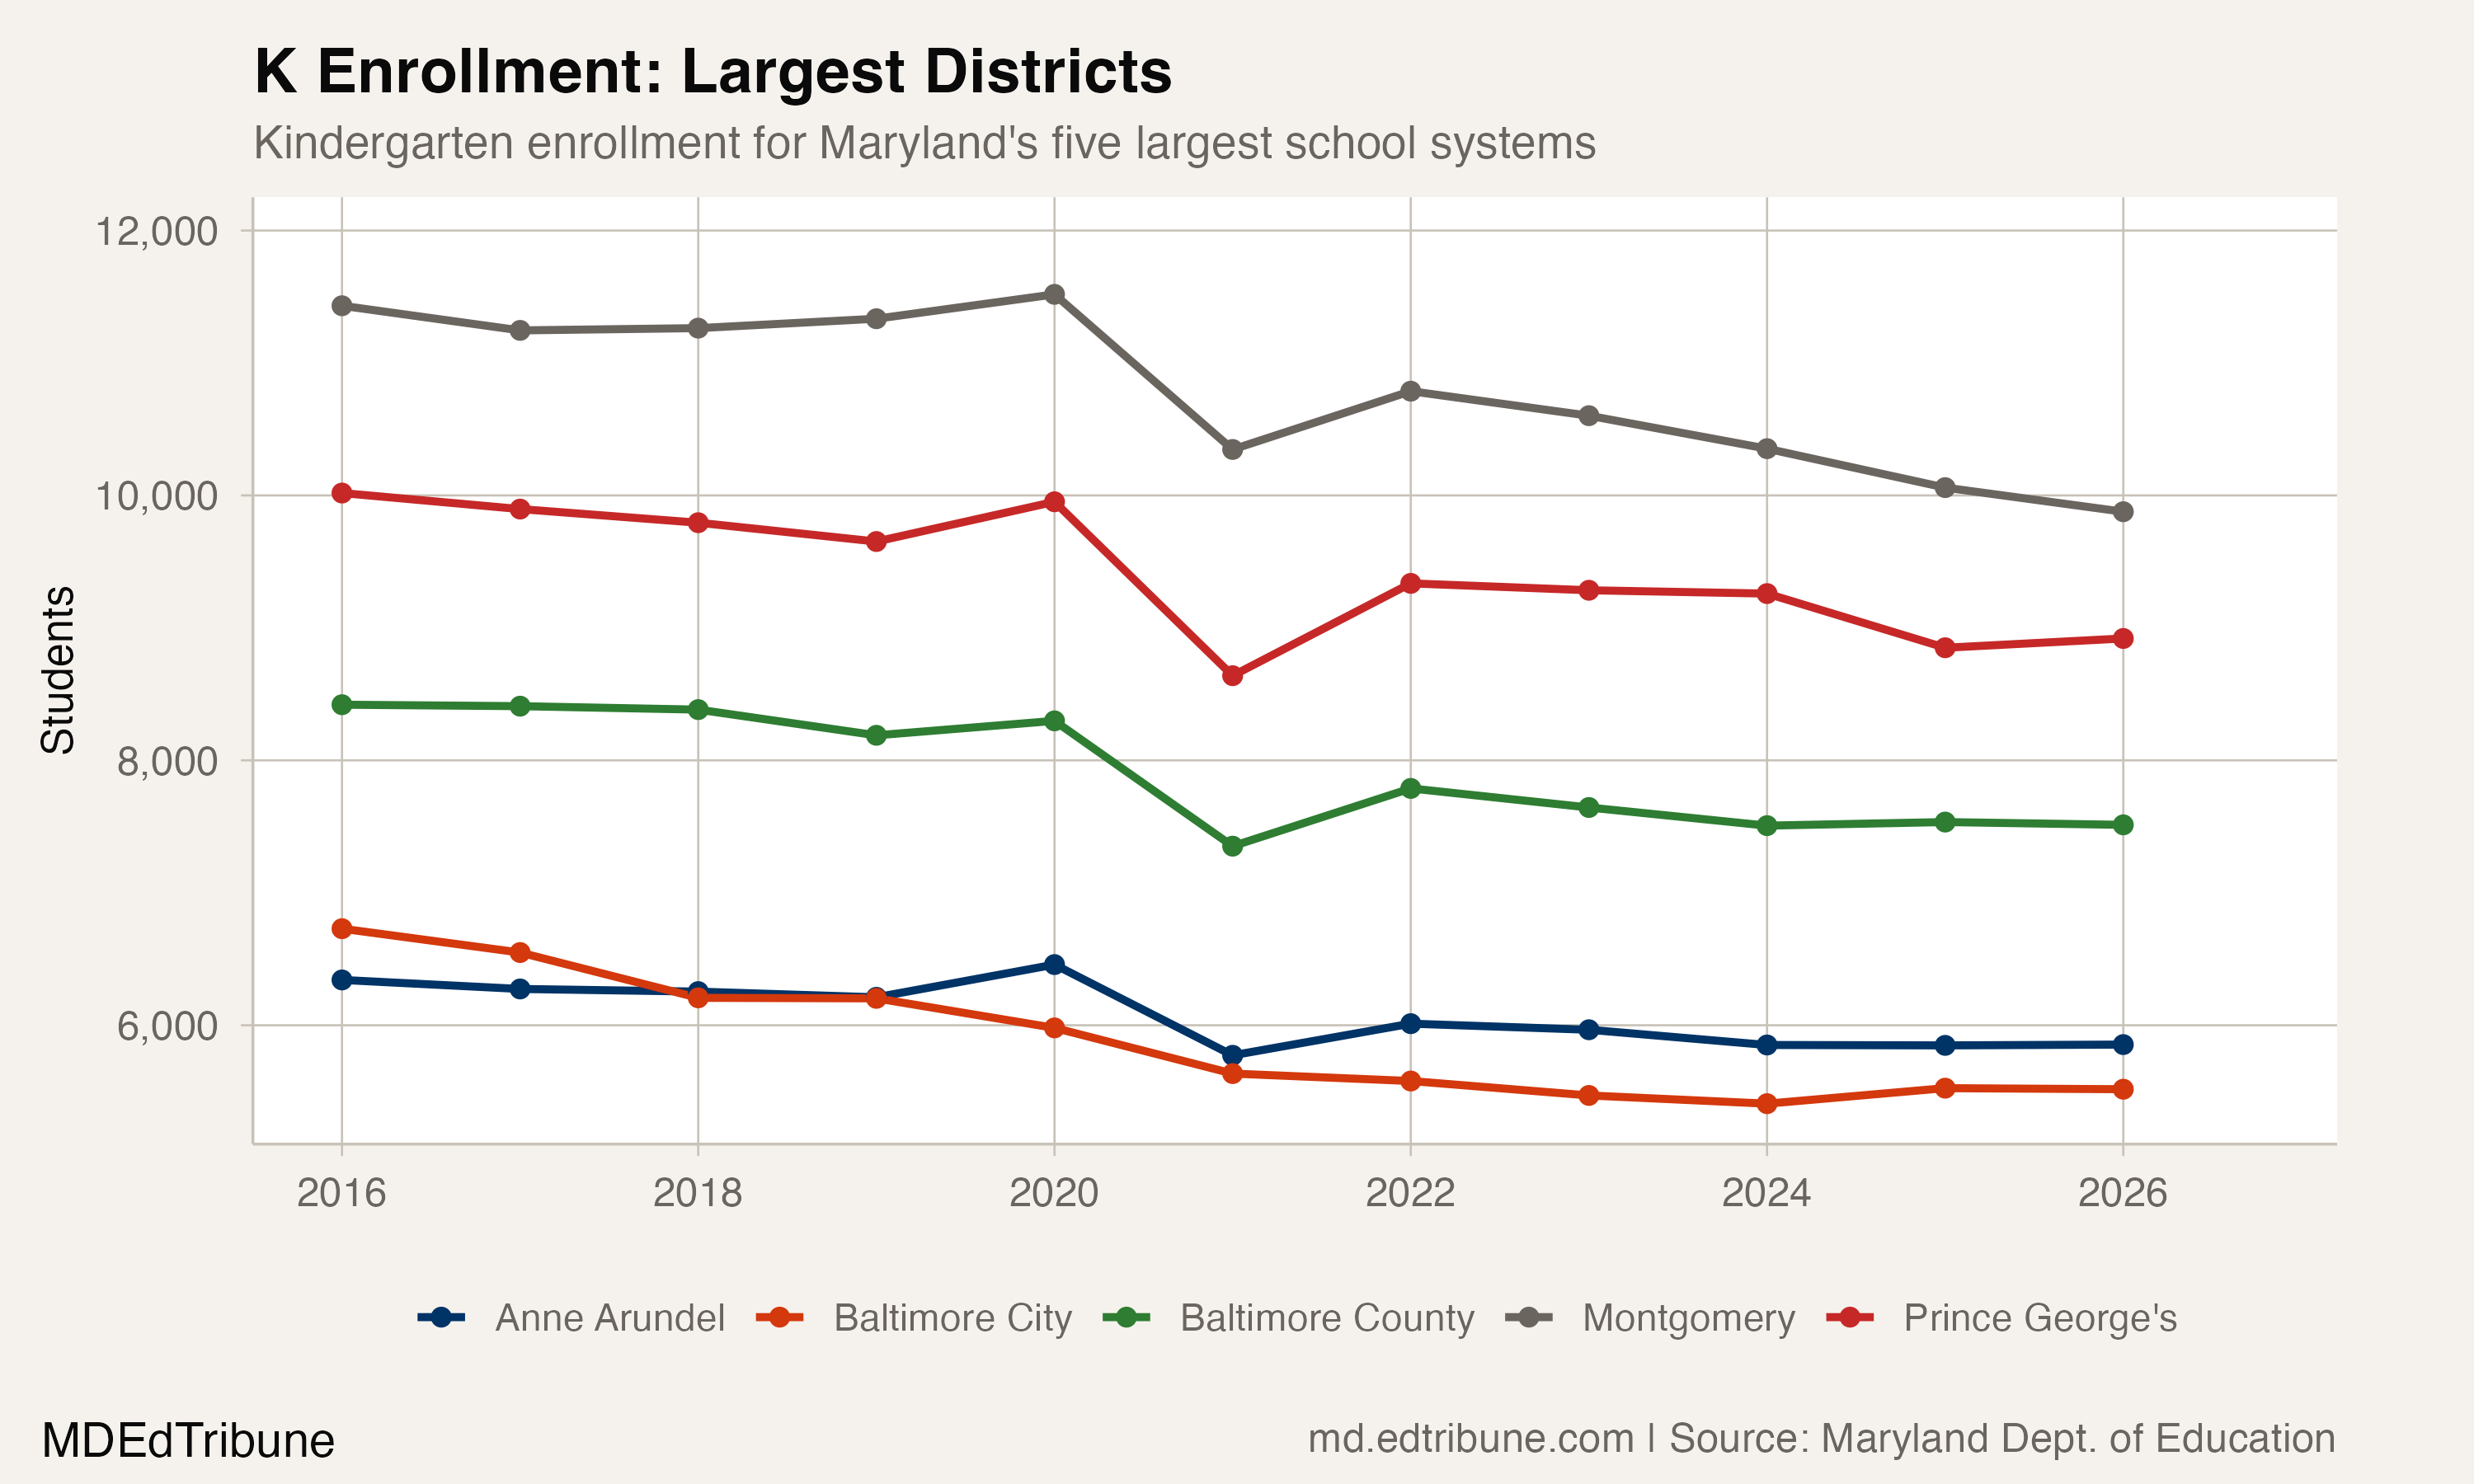
The math is straightforward but unforgiving. Donald Connelly, MCPS capital budget manager, told WJLA that the birth decline "translates five years later, six years later to kindergarteners." In Montgomery County↗ET specifically, births fell from over 13,000 in 2014 to fewer than 11,000 by 2023. Montgomery's K enrollment has tracked that drop almost exactly: from 11,518 in 2019-20 to 9,877 in 2025-26, a 14.2% decline that brought the district to its all-time low.
Marguerite Roza, director of Georgetown University's Edunomics Lab, was blunt in an interview with The Baltimore Banner:
"Birthrates are cratering across the nation, and the decline will seriously remake education."
Birth rates are a national phenomenon, but Maryland's version carries a local twist. Between 2019 and 2024, Montgomery County added 15,925 housing units, yet MCPS enrollment fell by 6,085 students. New housing is not generating new students.
The immigration factor
Birth rates are not the only force at work. Federal immigration enforcement has introduced a second, more sudden pressure on kindergarten enrollment, particularly in districts with large immigrant communities.
At the start of the 2025-26 school year, MCPS welcomed just 111 newcomer students, defined as children who are brand-new to the country or returning after years abroad. By the same point in 2023-24, the district had welcomed more than 400. Statewide, Maryland schools served 4,033 fewer English language learner students than the prior year.
Montgomery County Executive Marc Elrich attributed part of the decline to "Trump's actions around deportation, where people have either already been deported or are worried about being deported." Disentangling immigration enforcement from the birth-rate trend is difficult with enrollment data alone. Maryland's enrollment files do not include demographic breakdowns, so the relative contribution of each force remains unclear.
What is clear is that both forces push in the same direction, and both are concentrated in the state's largest systems.
Where the losses are concentrated
Montgomery County↗ET and Prince George's County↗ET together account for 2,673 of the 5,883 kindergartners lost statewide since 2019-20, or 45% of the state's K decline. Add Baltimore County↗ET, Anne Arundel↗ET, and Howard County↗ET, and the five largest systems account for 77% of the loss.
Three districts hit their lowest K enrollment on record in 2025-26: Montgomery (9,877), Howard (3,473), and Carroll↗ET (1,648). Montgomery's K class has not been this small at any point in the data going back to 2015-16. Howard has declined four straight years.
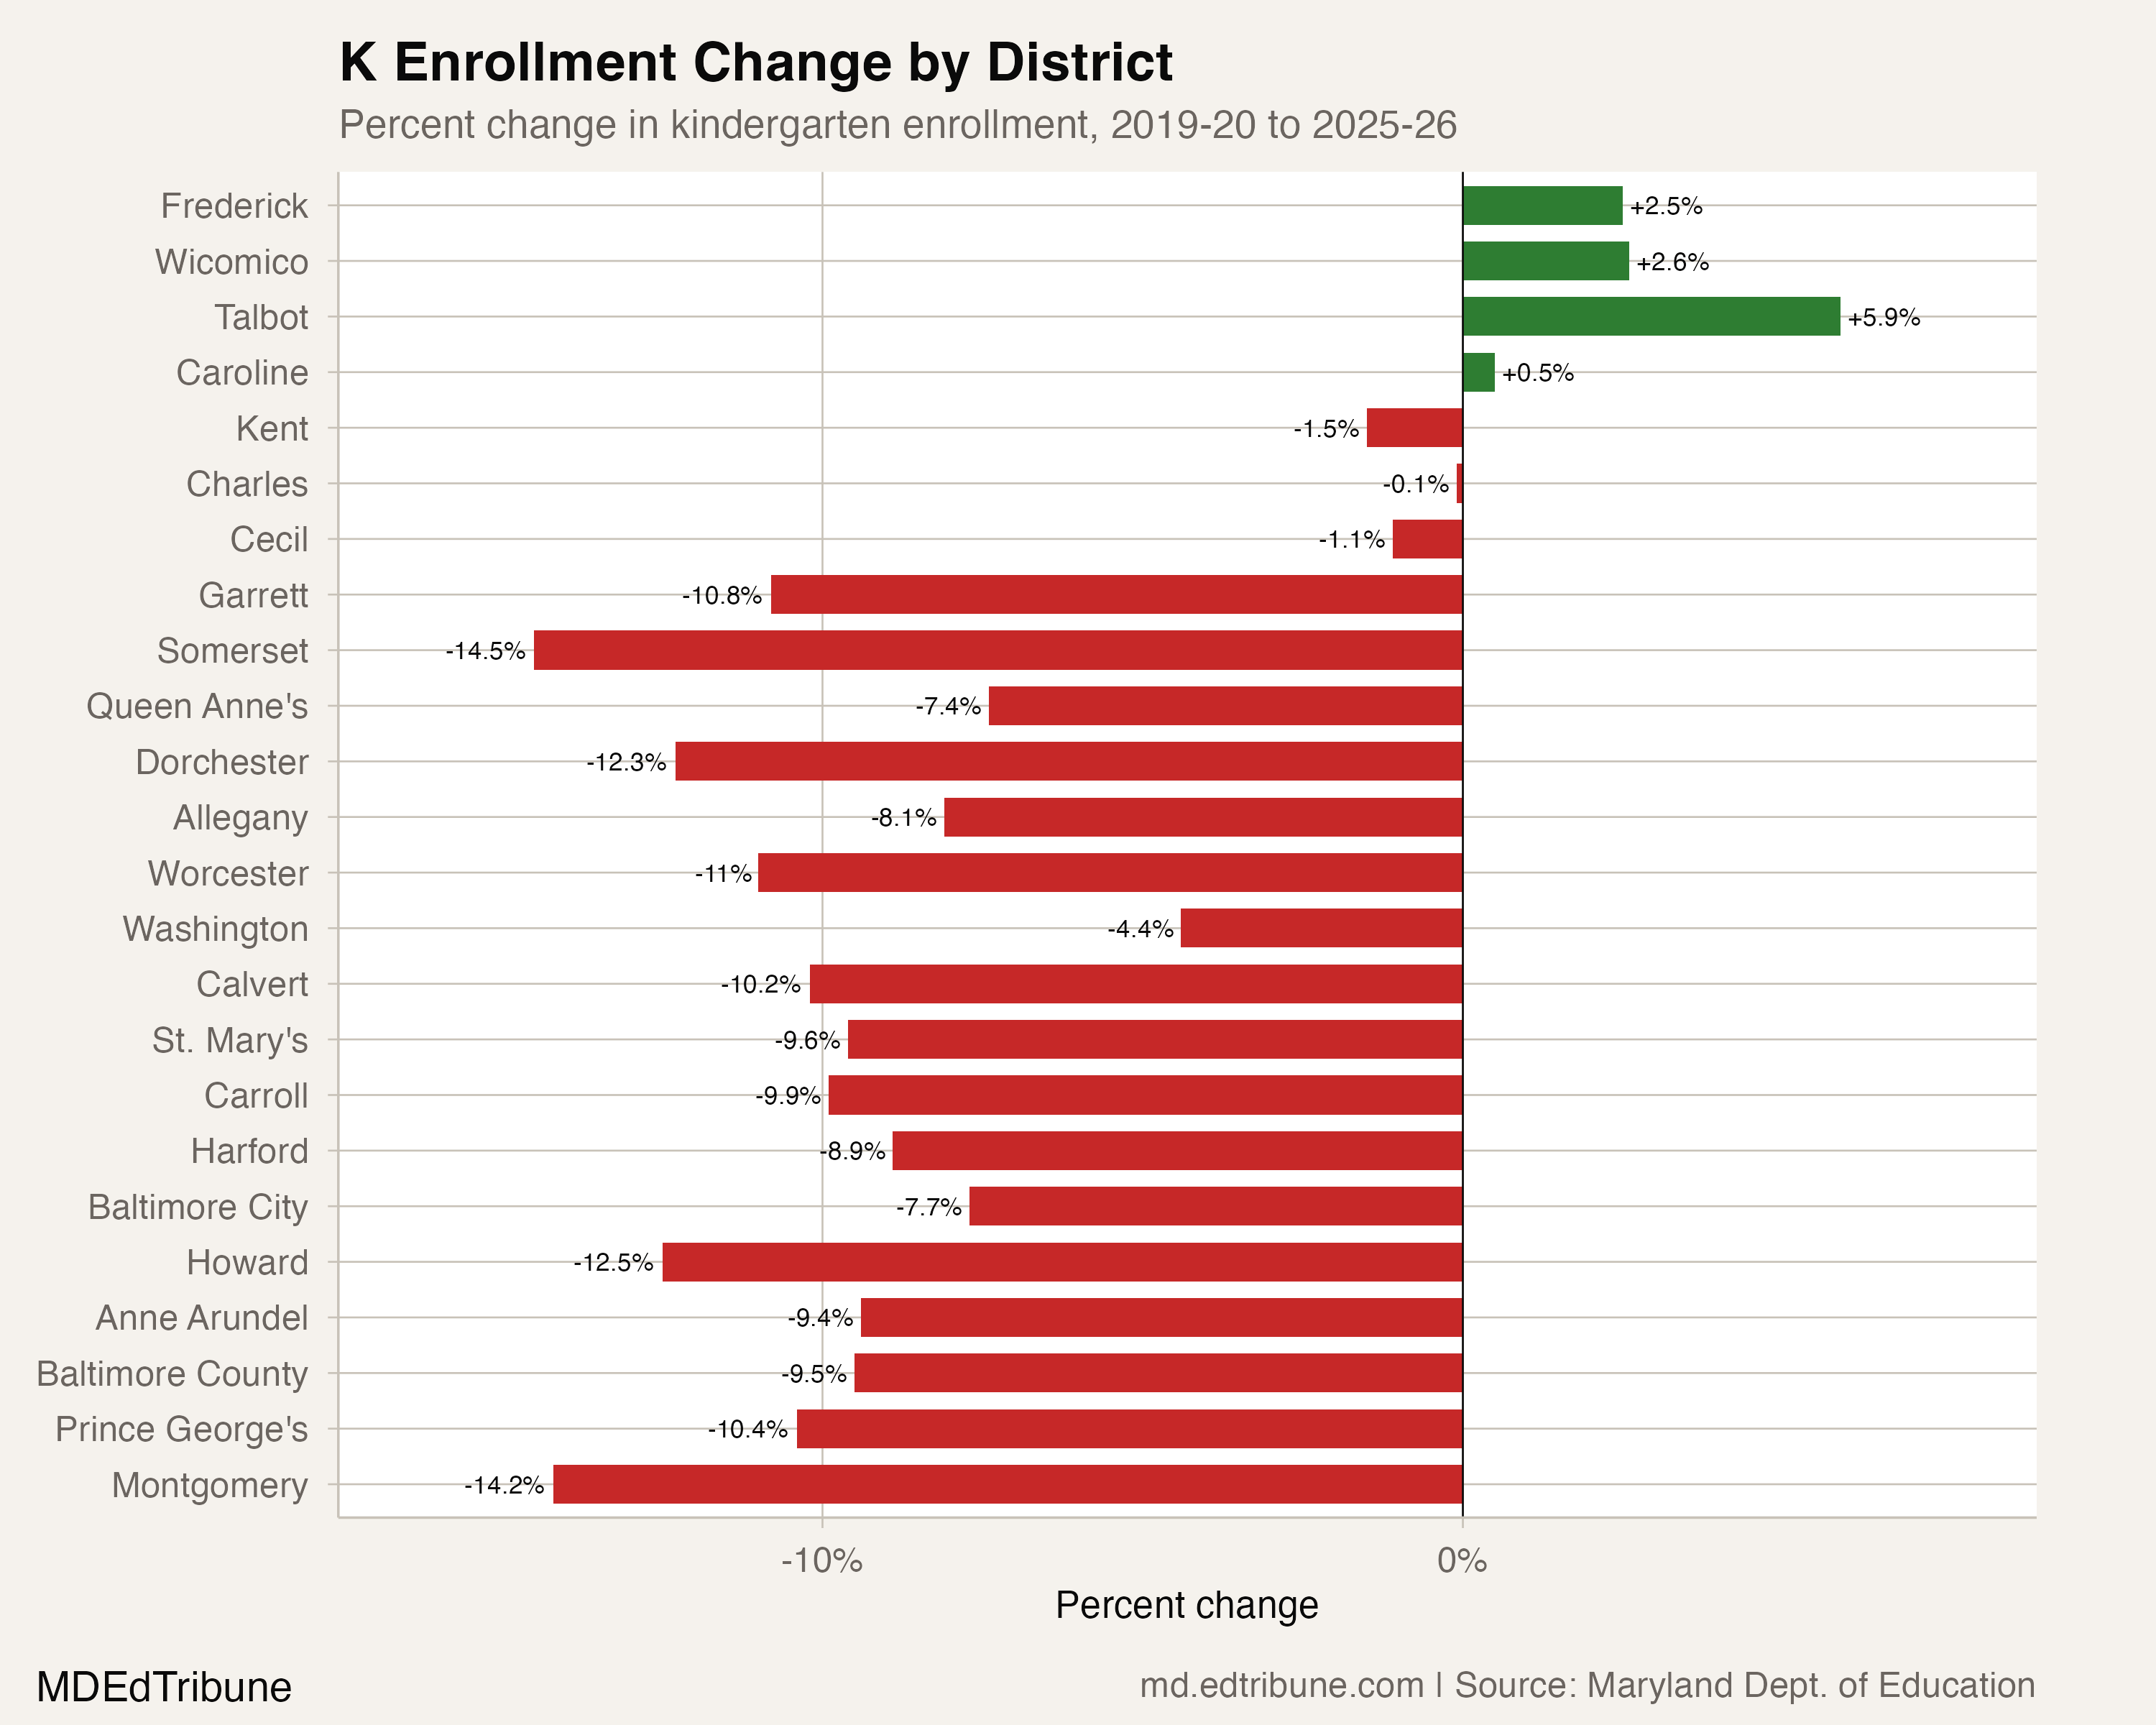
The geographic pattern is not uniform. Only four of 24 districts enrolled more kindergartners in 2025-26 than in 2019-20: Frederick↗ET (+2.5%), Talbot (+5.9%), Wicomico (+2.6%), and Caroline (+0.5%). Frederick stands out as the sole large district bucking the trend, with K enrollment of 3,177, up 15.4% over the decade. Frederick's growth aligns with its status as Maryland's fastest-growing county, with population rising 7.5% between 2020 and 2023 alone.
Baltimore City↗ET presents a different trajectory. Its K enrollment was already falling before COVID, dropping from 6,729 in 2015-16 to 5,980 in 2019-20. The pandemic accelerated an existing decline. At 5,517 in 2025-26, the city's K class is 18.0% smaller than it was a decade ago.
The ripple through the grades
Kindergarten is grade zero of a 13-year pipeline. When 58,391 students entered kindergarten during the COVID year of 2020-21, that cohort did not stay small. By the time those students reached fifth grade in 2025-26, the class had grown to 65,076, as students entered the system through transfers and late enrollment. First grade consistently exceeds the prior year's kindergarten by 2% to 5%, a pattern that held every year except 2020-21 itself, when COVID kept students out.
But the growth that occurs after kindergarten does not erase the starting deficit. The 2025-26 elementary grades tell the story: K through grade 3 are all smaller than they were in 2015-16, with losses ranging from 4,462 (grade 3, down 6.5%) to 6,582 (grade 1, down 9.7%). Meanwhile, grades 9 through 12 are all larger, reflecting the bigger cohorts that entered kindergarten a decade ago. Grade 9 enrollment jumped 8.9% to 75,813. Grade 12 rose 10.1% to 64,391.
This inversion will eventually resolve itself. The smaller elementary cohorts will age into middle school, then high school. Maryland's total K-12 enrollment, which dropped more than 1% in 2025-26 alone, will face additional downward pressure as the bulge in upper grades graduates and is replaced by smaller classes from below.
What the funding formula sees
Maryland's Blueprint for Maryland's Future, the state's $3.8 billion education reform law, funds schools on a per-pupil basis. The foundation amount rises each year, from $8,310 per student in 2022-23 toward a target of $12,365 by 2032-33. But per-pupil increases cannot fully compensate for falling headcounts, because many school costs are fixed: buildings still need heat, buses still run routes, and a classroom with 18 students requires the same teacher as a classroom with 22.
The Baltimore Sun reported that "city schools with declining enrollment will struggle to pay teachers a higher salary and could potentially close." MCPS projects a loss of roughly 7,000 additional students over the next six years. If each student carries approximately $10,000 in state and local per-pupil funding, that projection implies $70 million in reduced revenue, even as the district operates 238 school buildings.
Montgomery County Executive Elrich acknowledged that the system "won't have to hire additional teachers to maintain class size" but warned that further declines "can create issues in terms of class sizes if student populations fall too small," forcing a choice between undersized classes and consolidation.
A forecast written in kindergarten rosters
The National Center for Education Statistics projects that Maryland will lose about 8% of its students by 2031. The kindergarten pipeline suggests the math behind that projection is already in motion. Maryland's births have not rebounded. The 2025-26 kindergarten class of 59,204 will become next year's first grade, and whatever kindergarten class enters in 2026-27 will almost certainly be drawn from an even smaller birth cohort.
The data do not show whether private school enrollment or homeschooling is absorbing some of the decline. Maryland superintendents have cited both as contributing factors alongside birth rates, but neither MSDE enrollment data nor the Maryland Department of Planning projections separate these flows at the kindergarten level.
What the data do show, unambiguously, is the trajectory: eight of the last 10 years have produced a smaller kindergarten class than the year before. The two exceptions were a statistical blip in 2019-20 and a post-COVID bounce in 2021-22. Neither reversed the underlying trend. For every district planning its staffing, its facilities, and its budget, the kindergarten roster is the clearest leading indicator available. In 20 of 24 Maryland districts, that indicator is pointing down.
Detailed code that reproduces the analysis and figures in this article is available exclusively to EdTribune subscribers.
Discussion
Sign in to join the discussion.
Loading comments...