This is part of The MDEdTribune's series on Maryland's 2025-26 enrollment data.
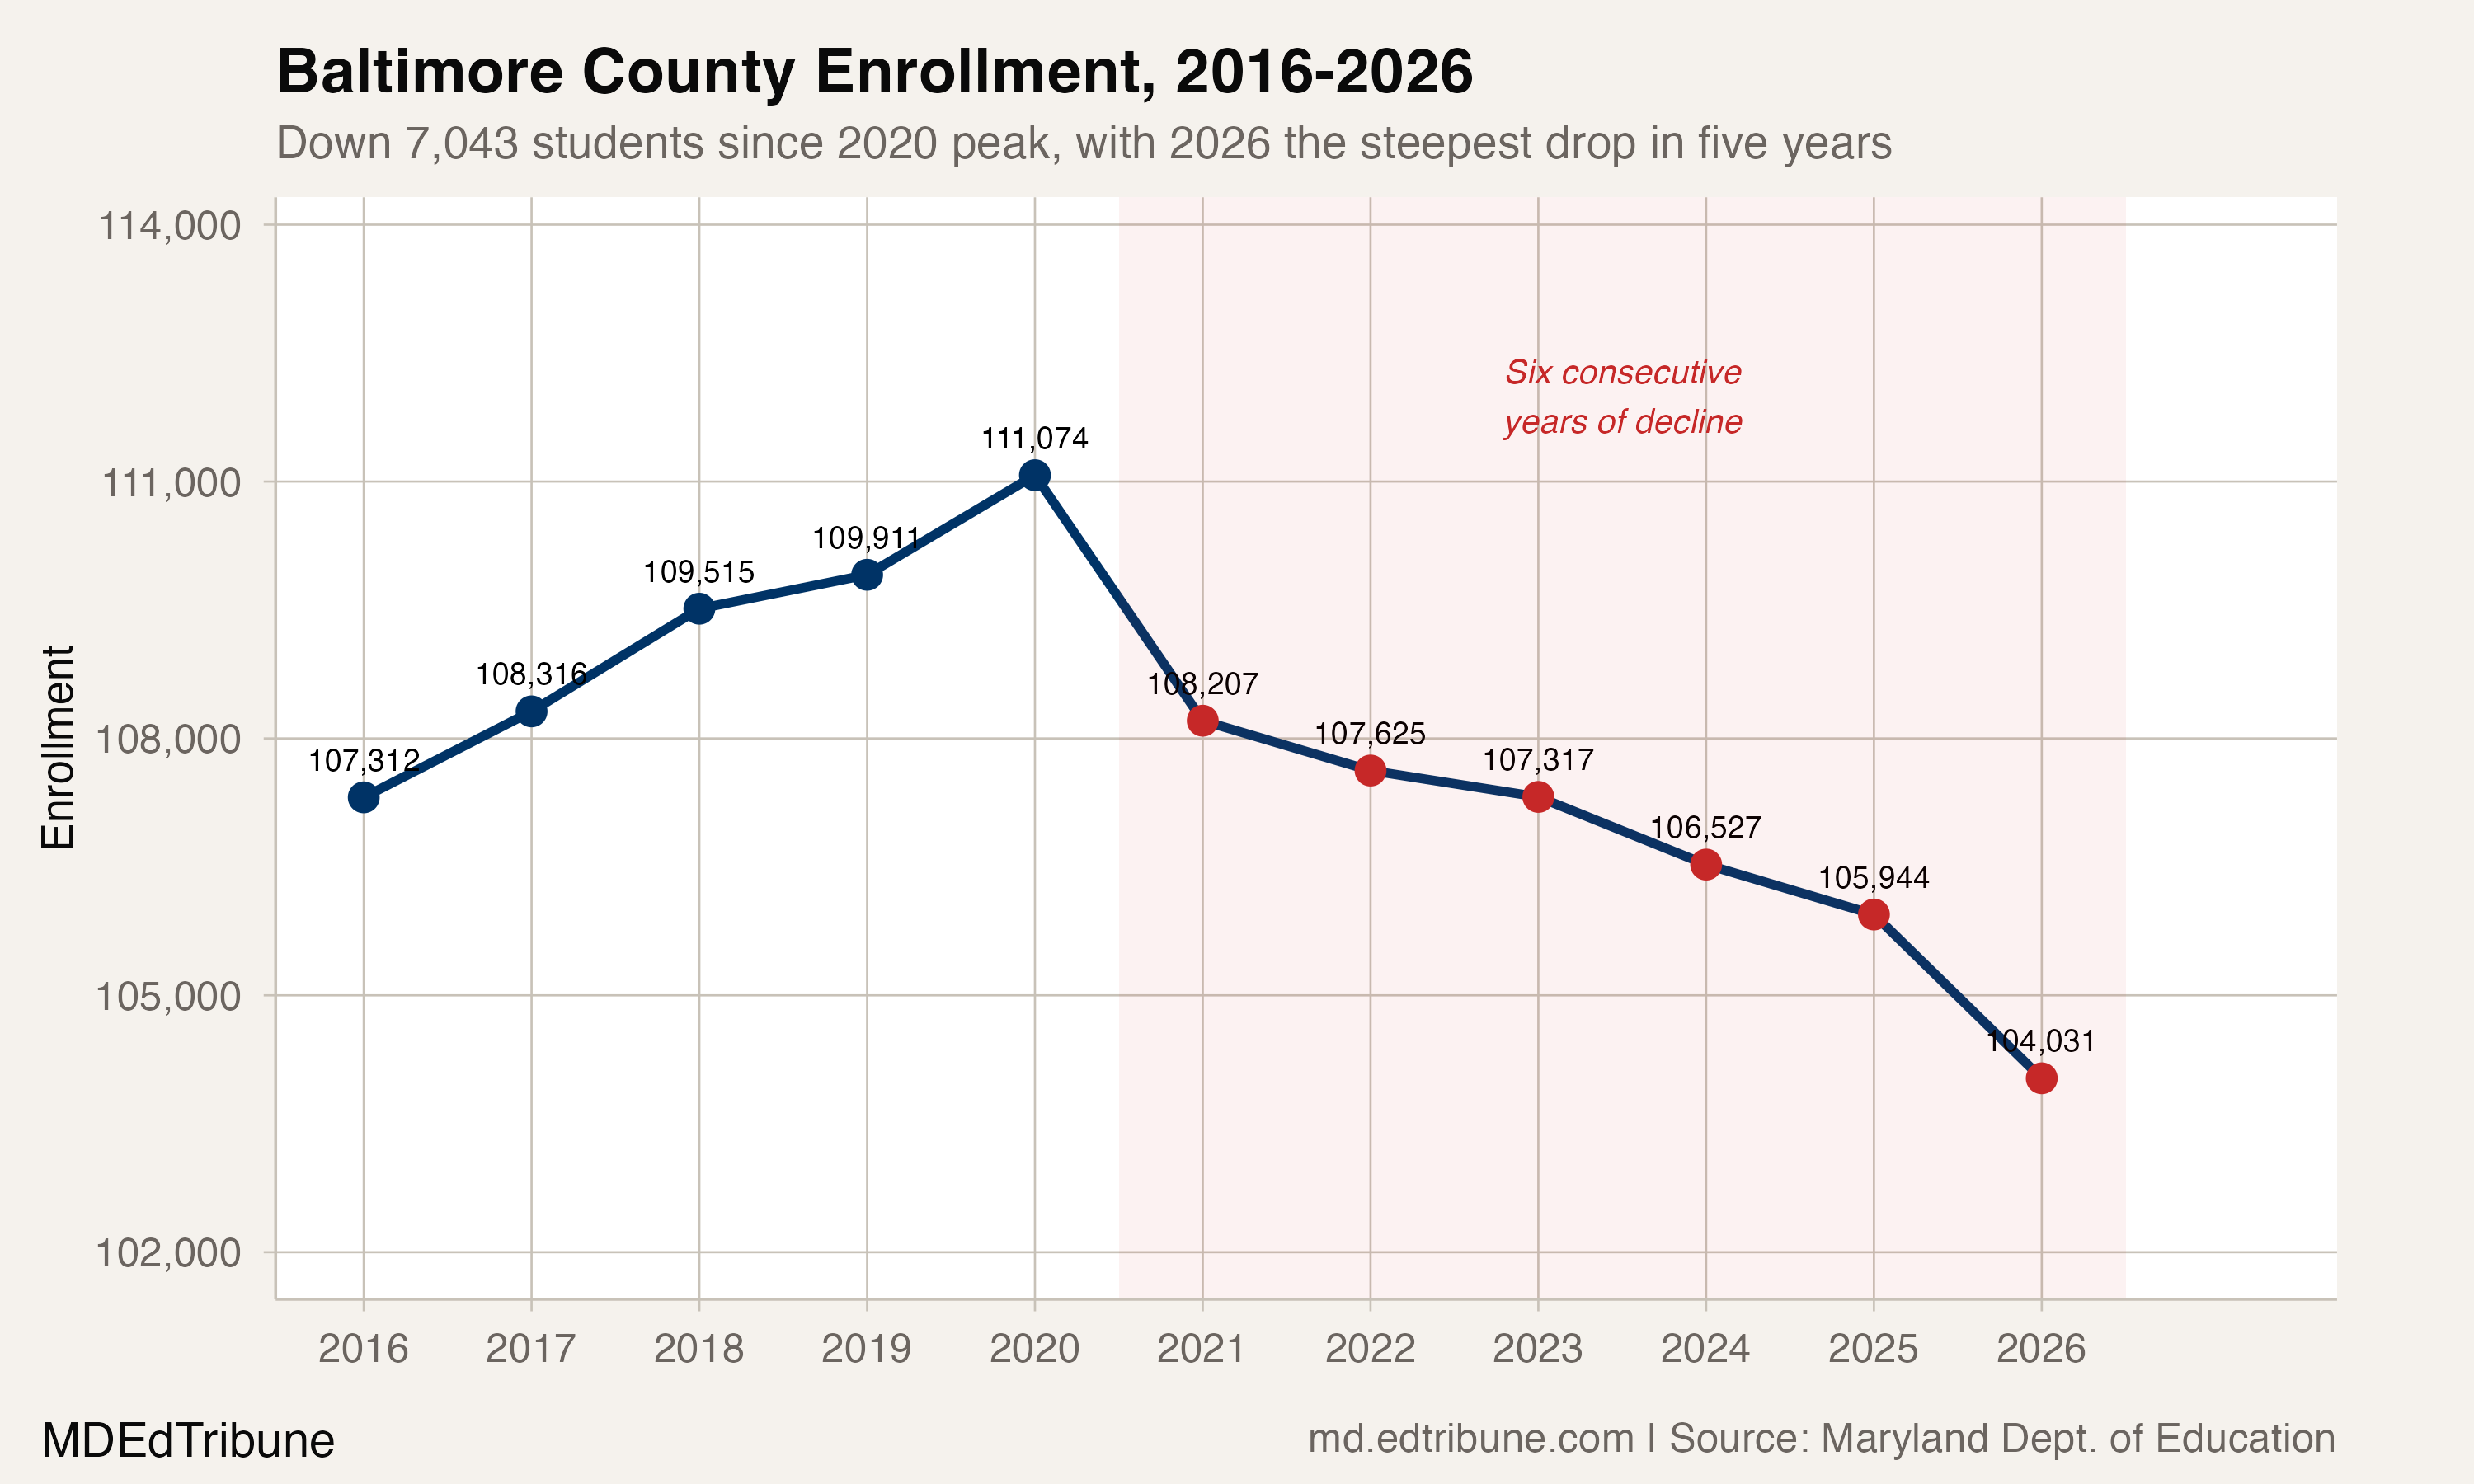
Baltimore County↗ET Public Schools lost 1,913 students in 2025-26, more than tripling the previous year's decline and pushing enrollment to 104,031. It is the lowest figure in the district's records.
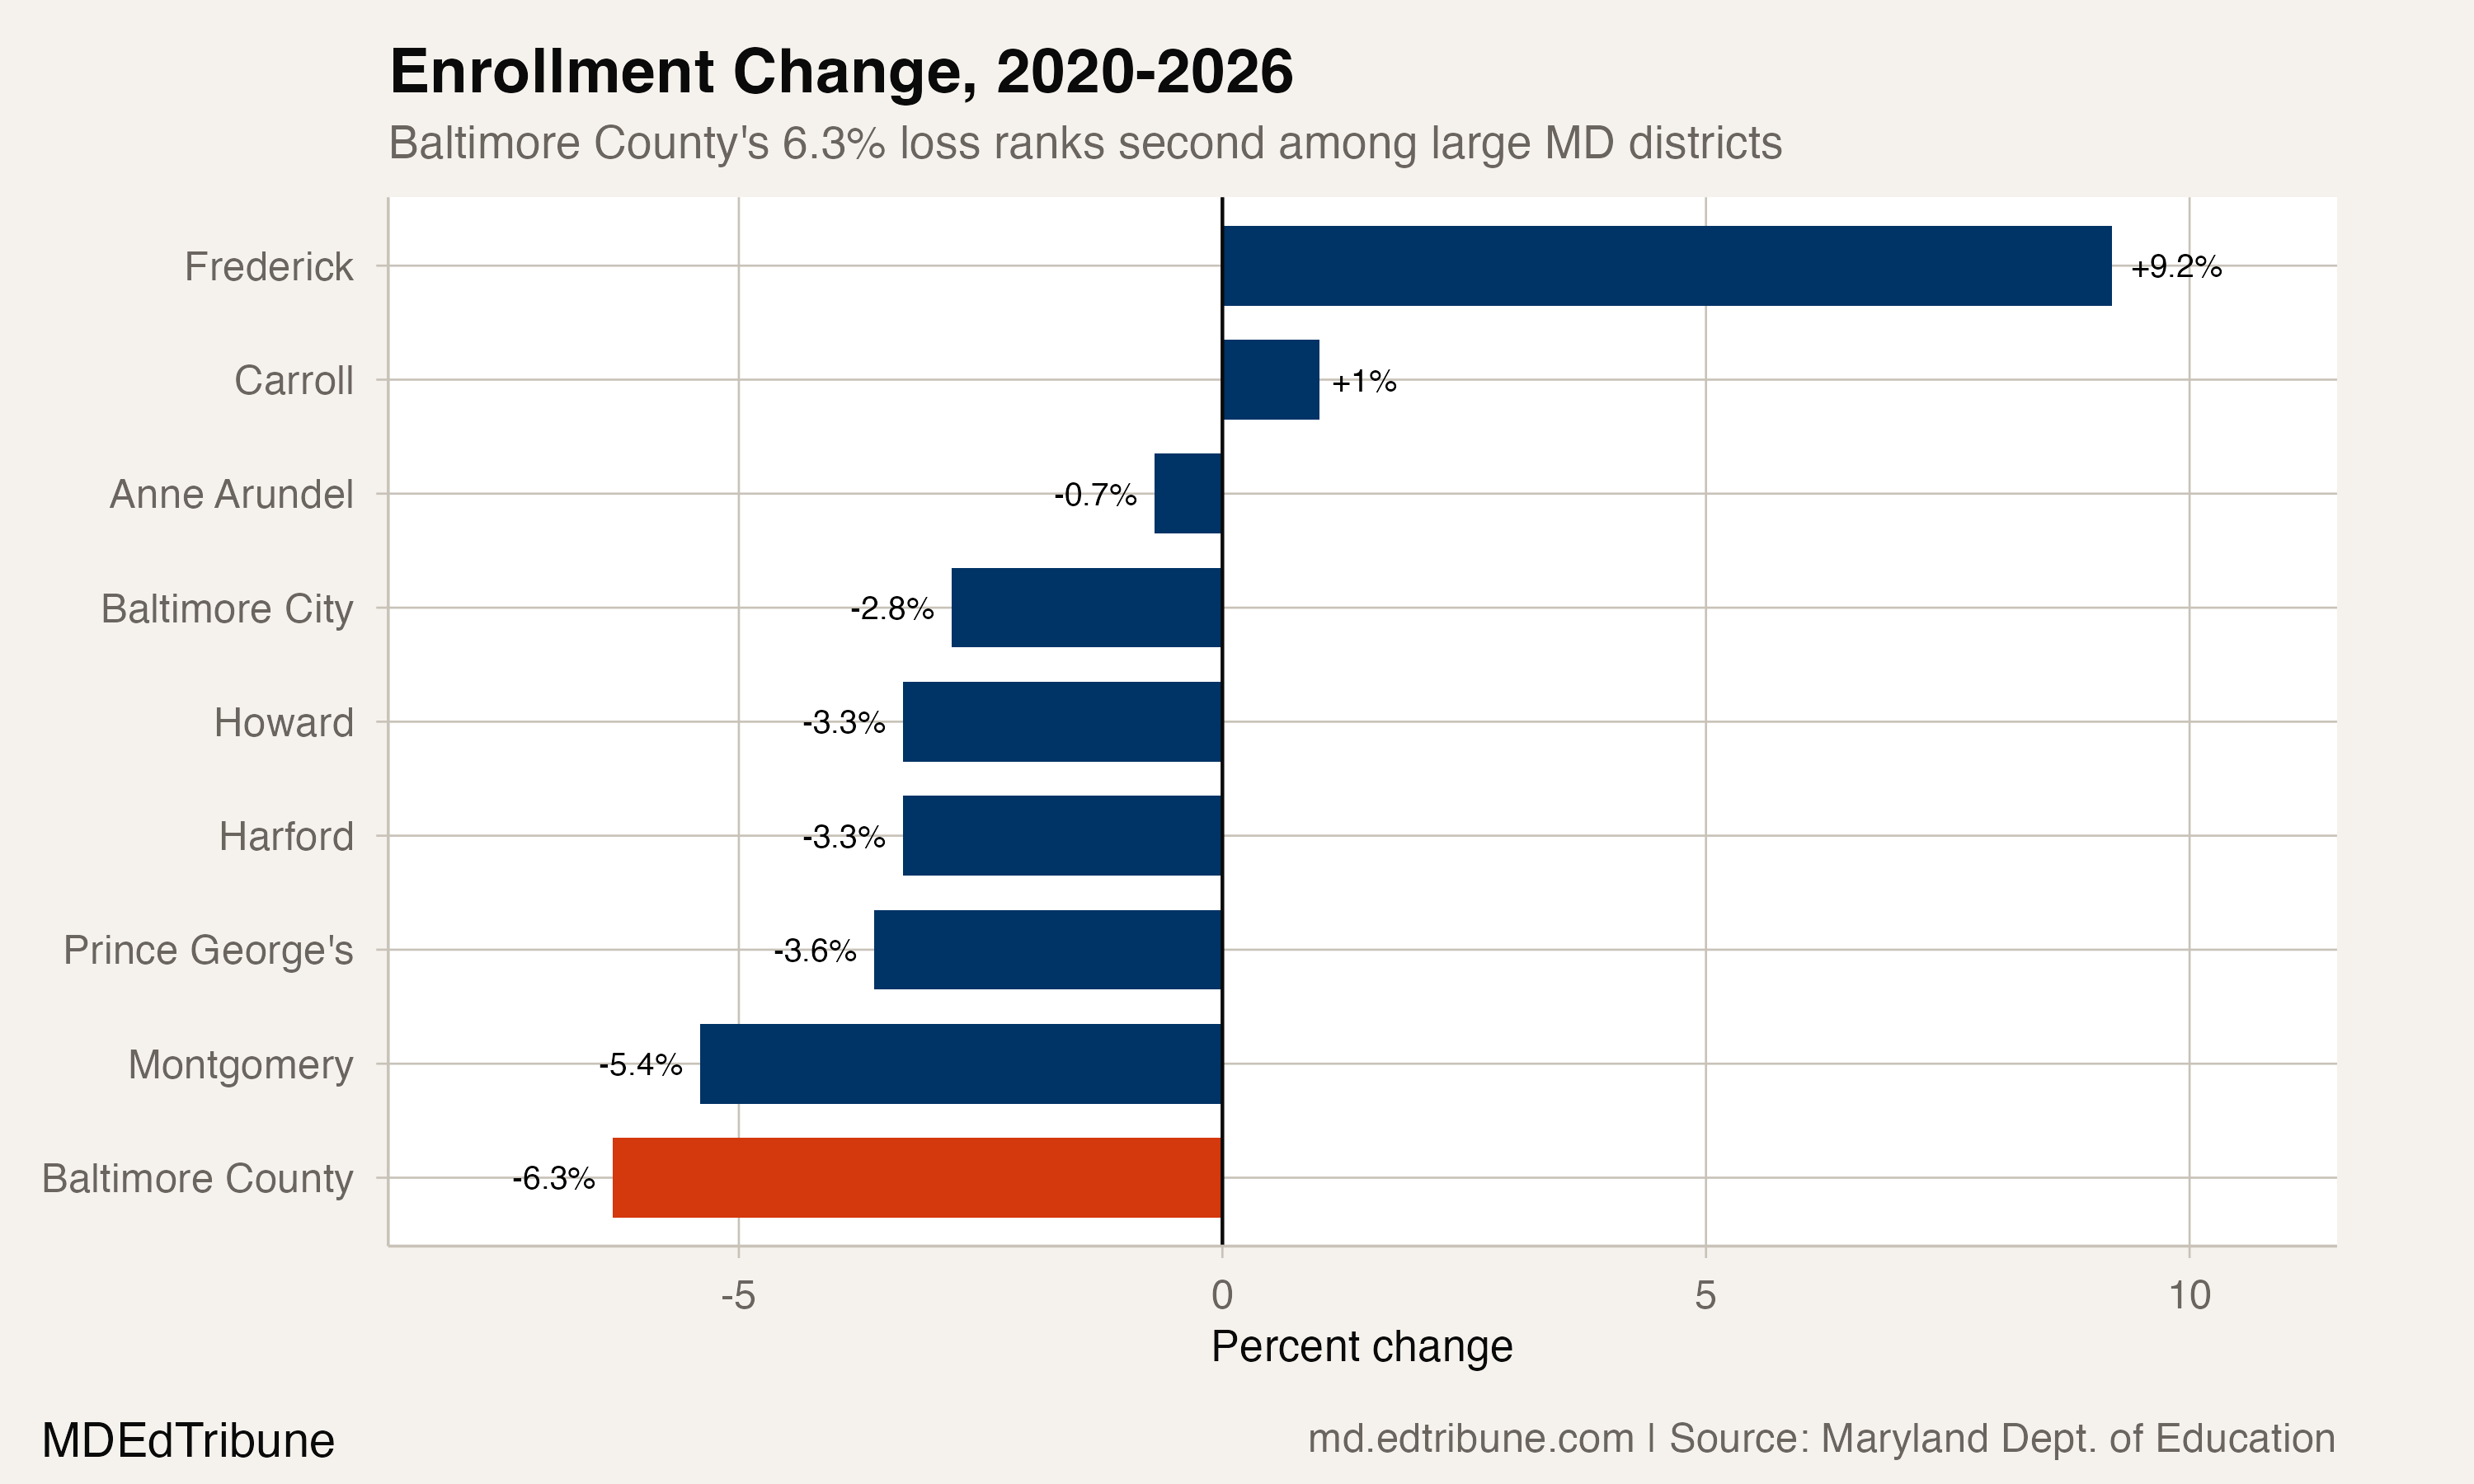
That single-year drop would be notable on its own. What makes it a structural story is context: it was the sixth consecutive annual decline, a streak matched by only two other Maryland districts, both rural systems with fewer than 5,000 students. Baltimore County, the state's third-largest school system, has shed 7,043 students since its 2020 peak of 111,074, a 6.3% loss that outpaces every other large district in the state.
The losses slowed, then didn't
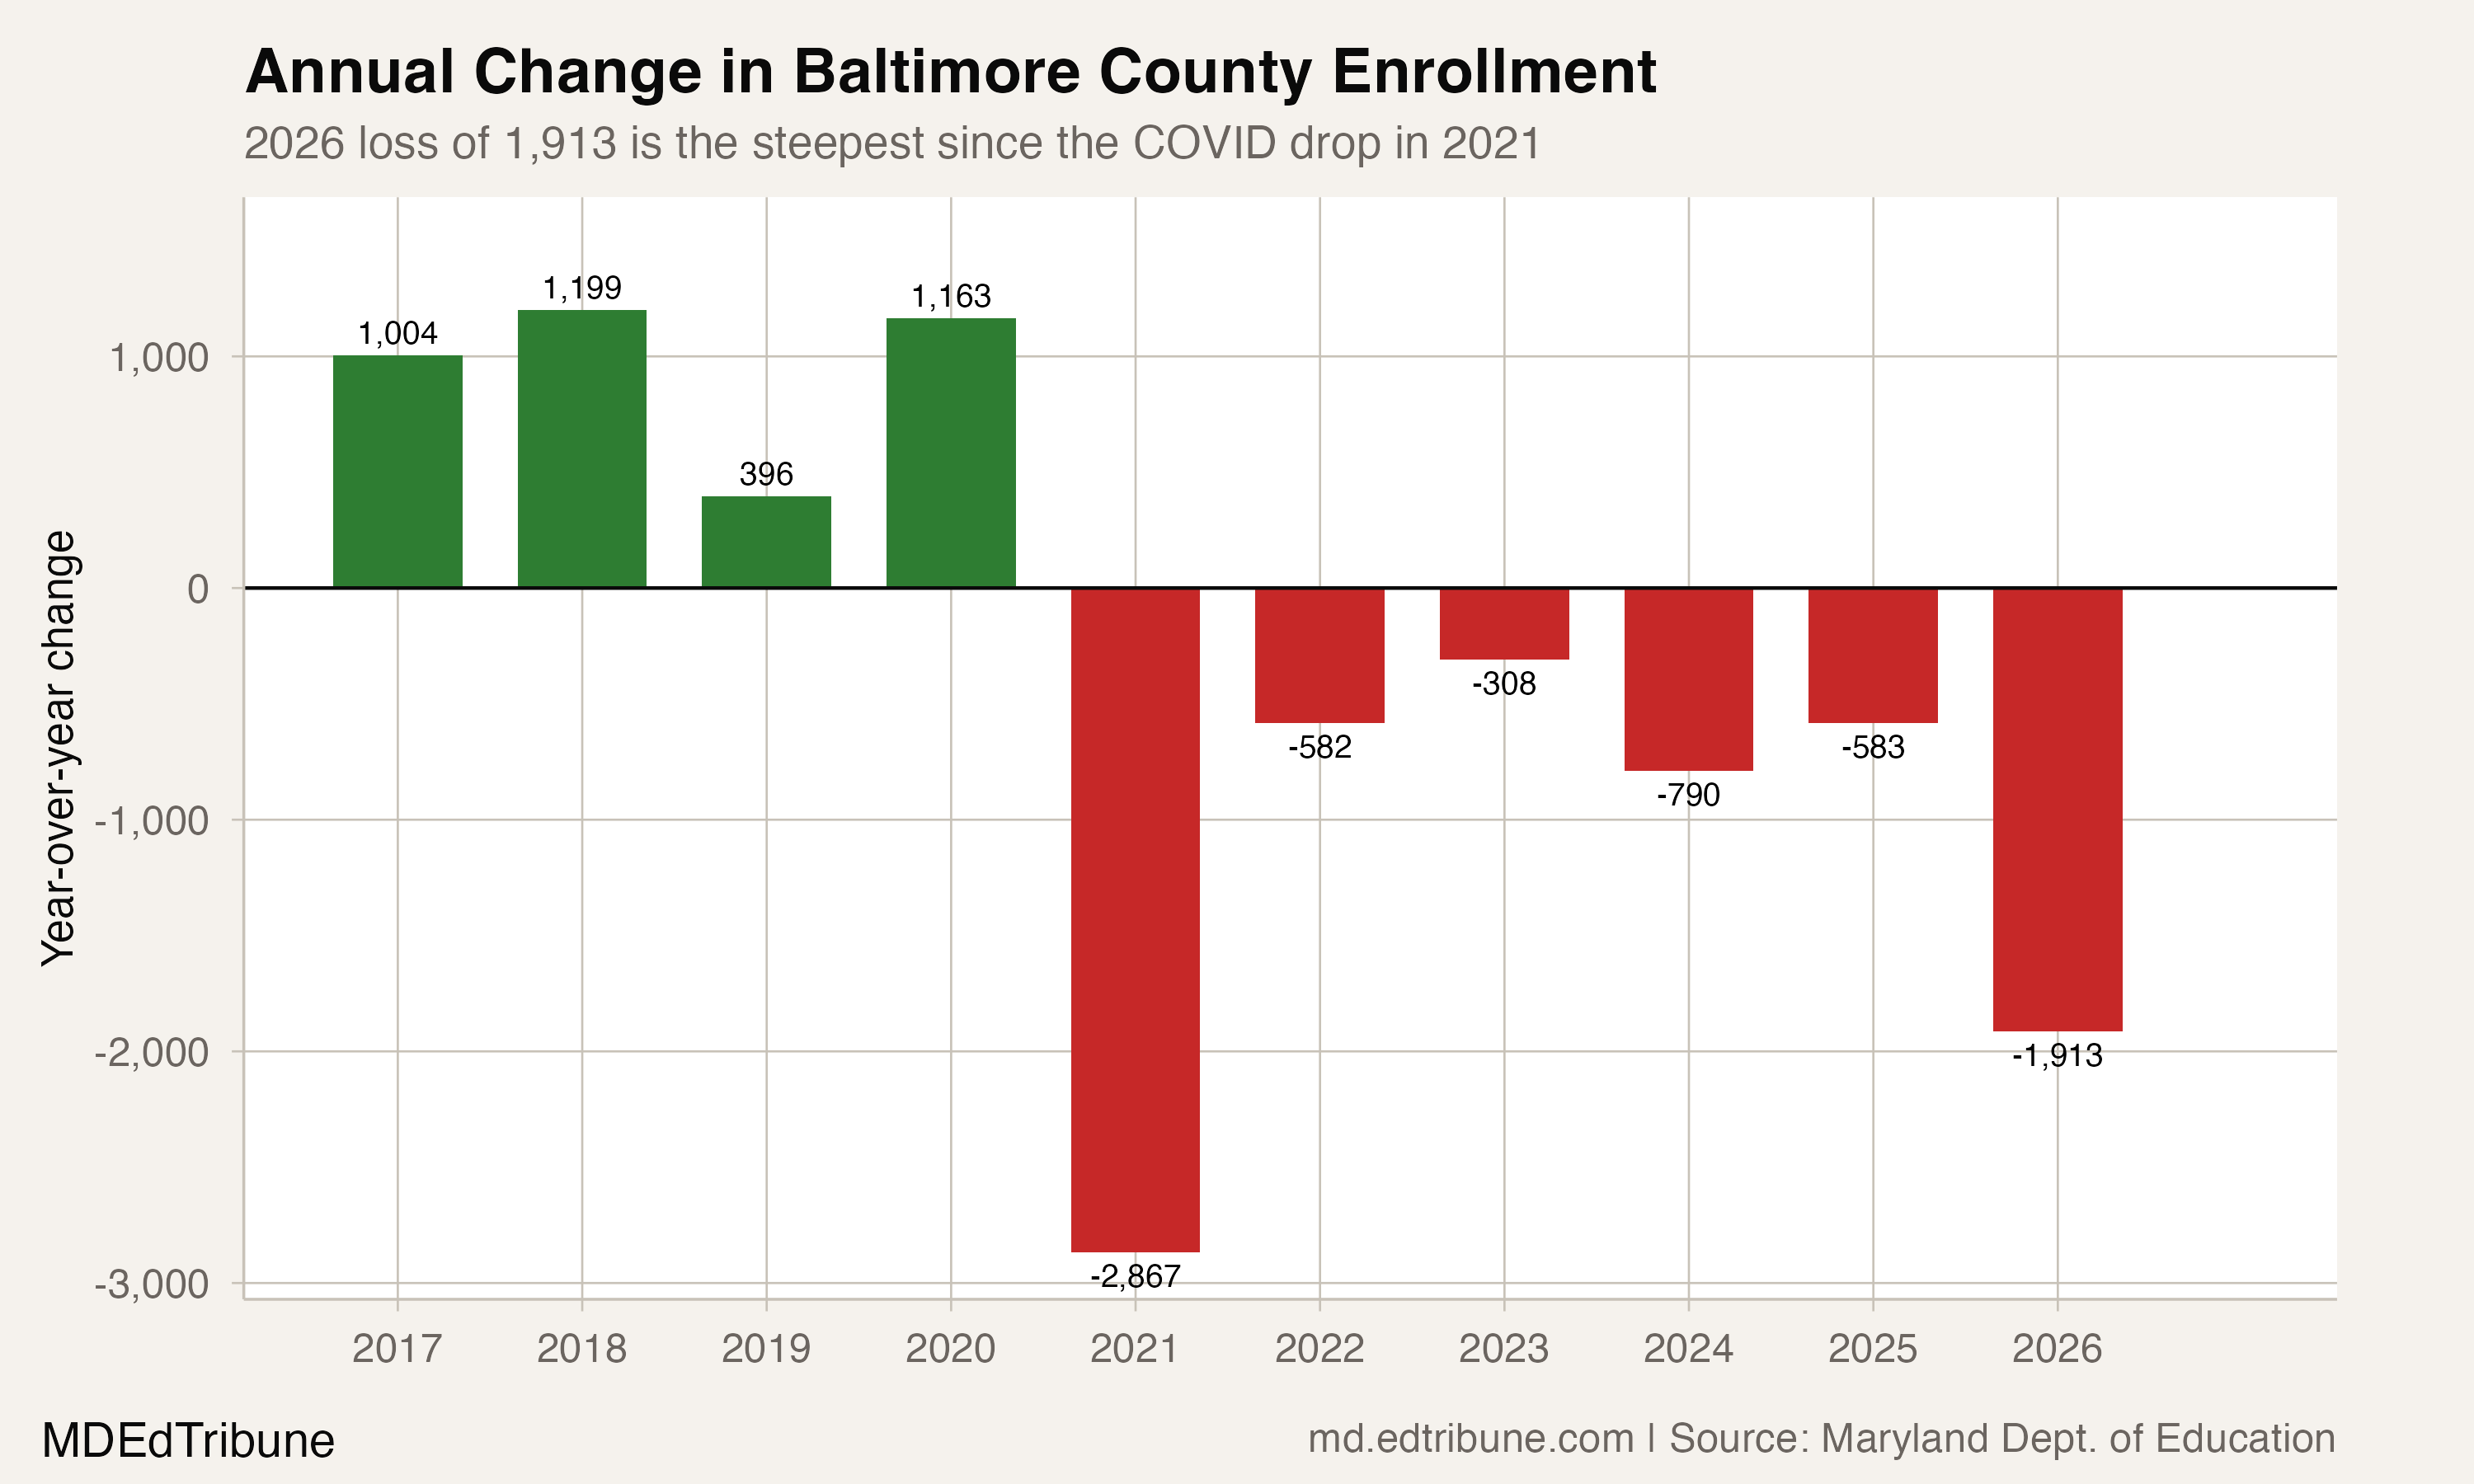
The trajectory of the decline matters as much as its depth. The initial COVID-era loss in 2020-21 was severe: 2,867 students, a 2.6% drop in a single year. What followed looked like stabilization. Annual losses shrank to 582 in 2021-22 and 308 in 2022-23, suggesting the district might be finding a floor.
It was not. Losses ticked back up to 790 in 2023-24 and 583 in 2024-25 before the 2025-26 plunge of 1,913, the worst single year since the pandemic's first hit. The pattern is not a slow bleed leveling off. It is a decline that paused, then re-accelerated.
Where the students aren't
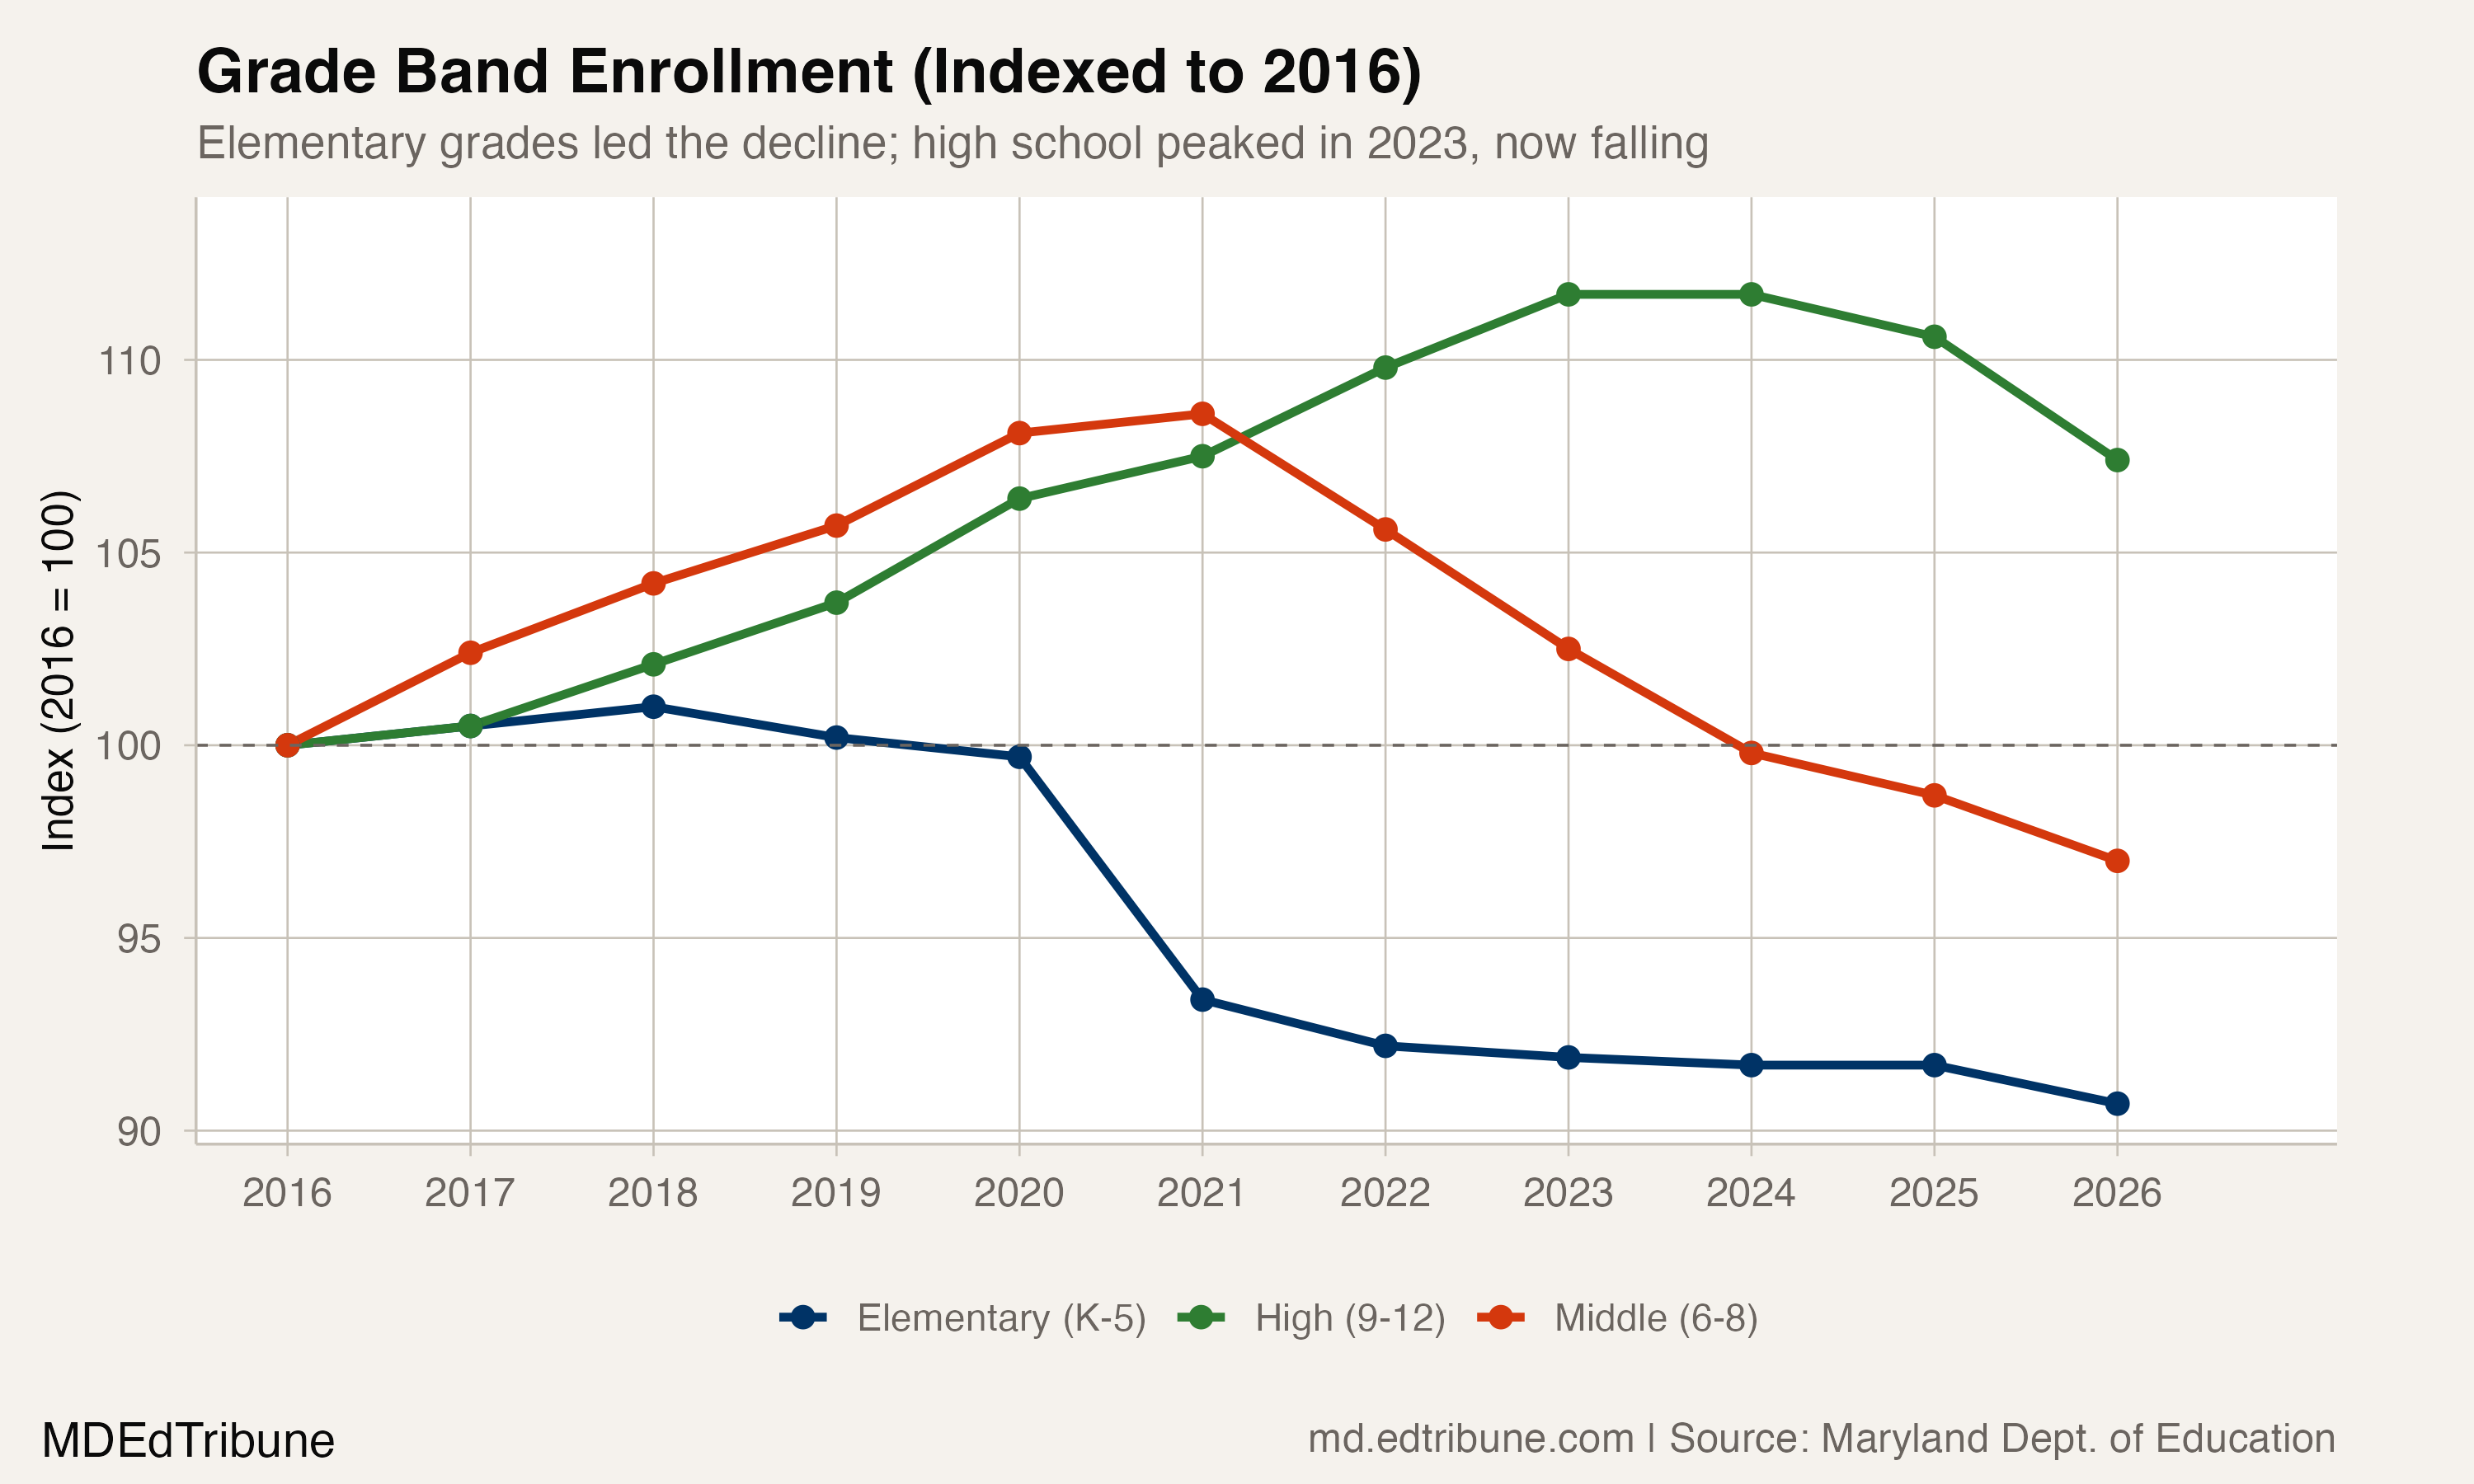
The grade-level data reveals a district being hollowed out from the bottom. Elementary enrollment (K-5) fell 9.0% from 2020 to 2026, a loss of 4,685 students. Middle grades (6-8) dropped 10.3%, losing 2,663. High school enrollment, buoyed by larger cohorts working their way through, peaked at 34,656 in 2023 but has since turned downward, losing 1,345 students in the past three years.
Kindergarten tells the pipeline story. Baltimore County enrolled 8,420 kindergartners in 2016. In 2025-26, it enrolled 7,513, a 10.8% decline over a decade. Those smaller entering cohorts propagate upward each year, guaranteeing continued losses in the elementary grades for years to come.
The 2025-26 grade-level data carries an unusual signature. Grade 10 lost 771 students, the single largest grade-level loss by far, accounting for 40% of the total decline. Grade 12 lost 329 and grade 2 lost 267. The grade 10 drop is large enough to suggest something beyond normal cohort flow, though without school-level data, the specific cause is not identifiable.
Shrinking faster than the state
Baltimore County's 6.3% loss since 2020 stands out even in a state where most districts are declining. Maryland as a whole fell from 876,810 to 849,698 over the same period, a 3.1% decline. In 2025-26 alone, every district in the state except Kent County lost students.
Among the state's nine largest districts, Baltimore County's percentage decline is the worst. Montgomery County lost more students in absolute terms (8,604), but from a much larger base, putting its rate at 5.4%. Frederick County, Baltimore County's neighbor to the west, grew 9.2% over the same period, adding 3,916 students.
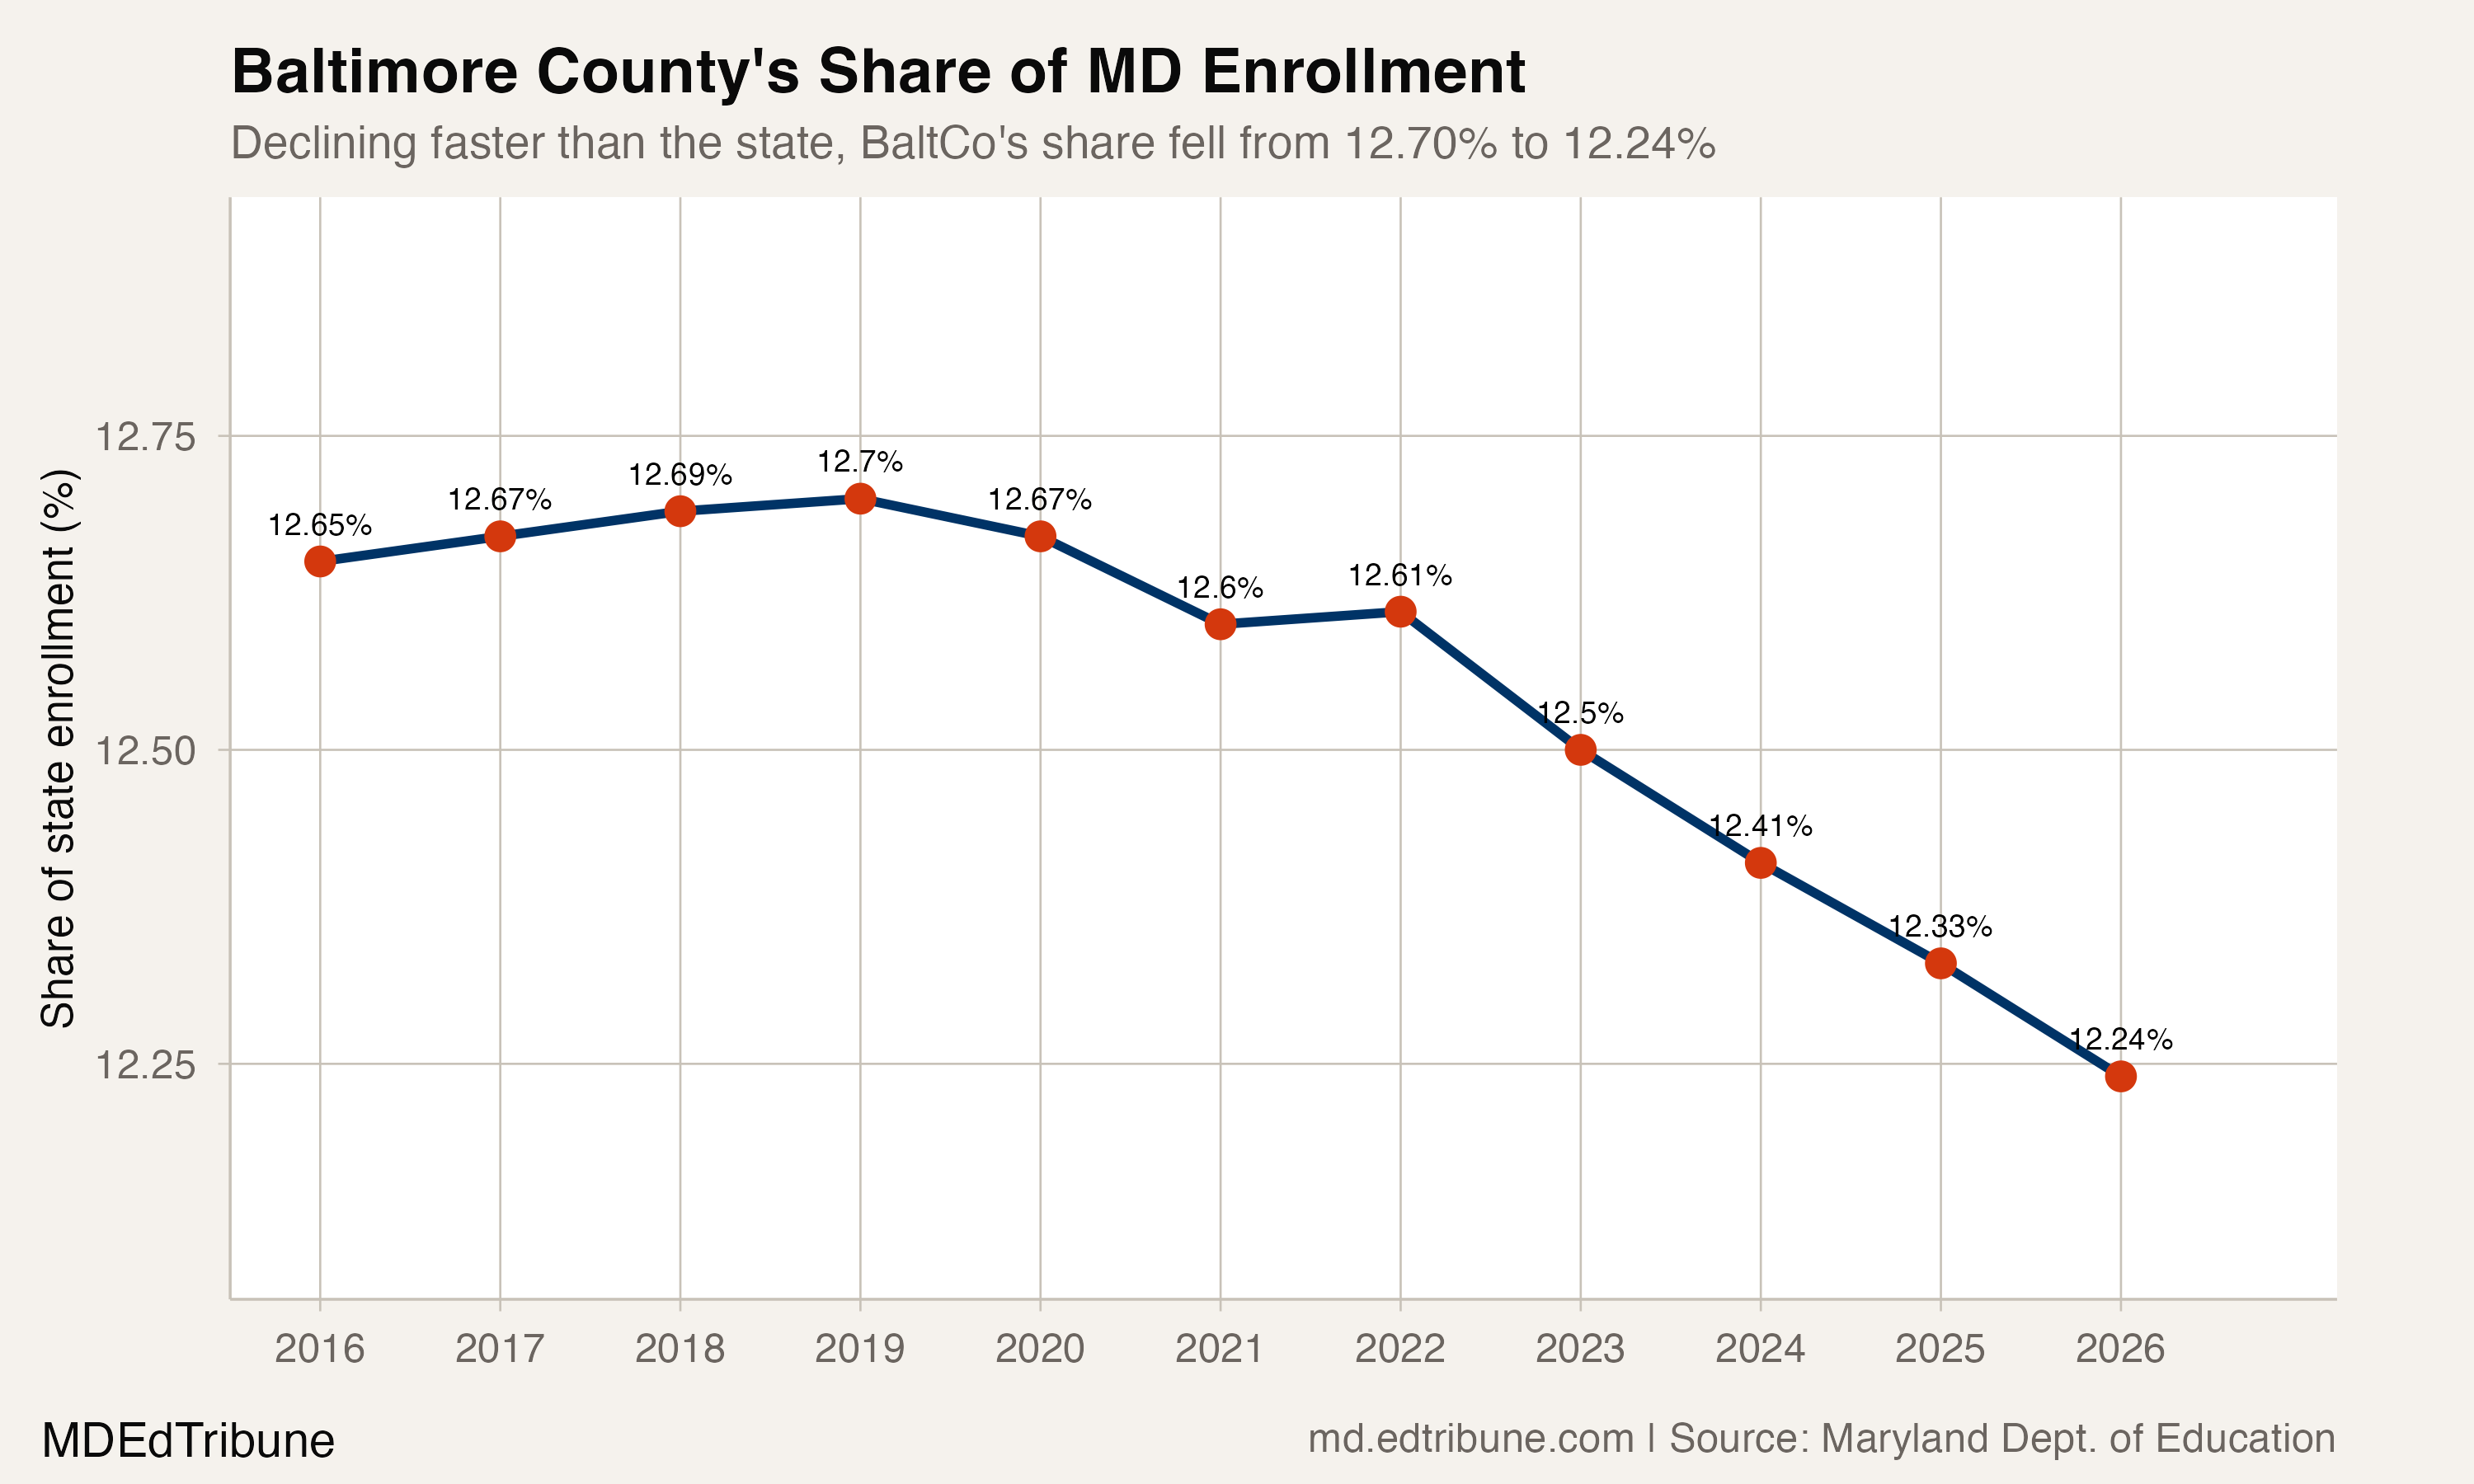
That divergence captures a regional dynamic. Baltimore County's share of Maryland's total enrollment slid from 12.70% in 2019 to 12.24% in 2026. The district is not just losing students. It is losing its proportional weight in the state's education system.
Outmigration and the exurban pull
The most likely driver is domestic outmigration, families relocating from Baltimore County to lower-cost exurban counties. Census estimates show Baltimore County lost population in 2022 and 2023, while Carroll County and Frederick County gained residents. Maryland's statewide domestic migration has been negative since 2020, with the Maryland Chamber of Commerce attributing the outflow to high taxes, rising housing costs, and regulatory complexity.
Falling birth rates are a contributing factor statewide. Maryland births declined from 74,316 in 2000 to 65,594 in 2023, an 11.7% drop, and the kindergarten data in Baltimore County reflects this pipeline compression. But birth rates alone cannot explain why Baltimore County declined 6.3% while its neighbor Frederick grew 9.2%. Something is redistributing families across the region, and housing affordability is the most plausible mechanism, even if the enrollment data cannot prove it directly.
The mdschooldata package does not include demographic breakdowns, so it is not possible to determine whether the losses are concentrated among particular racial or socioeconomic groups. That is a significant gap in understanding the nature of the decline.
$169 million in cuts and counting
The fiscal consequences have arrived. The Baltimore Banner reported in December 2025 that Superintendent Myriam Rogers has cut $169 million from the budget over two years, eliminating more than 400 positions, ending academic programs, and freezing central office hiring. Enrollment projections have been off by more than 2,700 students, compounding the budget uncertainty.
"Eliminating positions, potential salary reductions from prior negotiations, and supply and materials cuts are all on the table." -- Conduit Street (Maryland Association of Counties), May 2025
The Blueprint for Maryland's Future, the state's $3.8 billion education reform law, adds a paradoxical layer. Baltimore County's Blueprint costs reached $1 billion in fiscal year 2026, three years ahead of projections, even as the student population triggering that spending continues to shrink. The $1 billion figure exceeded updated state estimates by $123 million. Per-pupil costs are rising precisely because the denominator keeps falling.
Meanwhile, staffing has grown statewide even as enrollment drops. Maryland public schools added 10,202 employees from 2021 to 2026 while losing 2,307 students. Non-instructional staff rose 25%, compared to 7% for teachers. Whether that reflects necessary investment in student support or institutional inertia is a matter of perspective, but the cost trajectory and the enrollment trajectory are moving in opposite directions.
Unanswered
Several questions remain outside the reach of enrollment counts. The grade 10 loss of 771 students in a single year could reflect families leaving for private school, transfers to career and technical programs in other counties, or simple cohort variation. Without school-level data or exit surveys, the mechanism is opaque.
The role of school quality perceptions is similarly unmeasurable from enrollment data alone. Baltimore County's four-year graduation rate has hovered near the state average, but parental decisions about where to enroll are shaped by factors that aggregate statistics do not capture: individual school reputations, program offerings, perceived safety, commute times. The data shows that families are leaving. It does not say why any particular family left.
The question for 2027
The 2025-26 acceleration breaks a pattern that had looked like it might stabilize. If the 2026 loss was an anomaly, driven by a one-time factor like a large cohort graduating or a reporting adjustment, the district could return to the 500-600 annual losses of the preceding years. If it was the beginning of a new phase, with the pandemic's delayed effects compounding birth rate declines and outmigration, losses in the 1,000-2,000 range could become the norm.
Superintendent Rogers told Fox Baltimore in September 2024 that pre-kindergarten expansion would feed future enrollment growth, citing 2,000 full-time and 2,400 half-day pre-K seats. Whether pre-K students translating into kindergarten enrollment can offset the losses at every other grade level is the test. The kindergarten data so far is not encouraging: 7,513 kindergartners in 2025-26, essentially flat from the year before, and 10.8% below a decade ago.
For a district that has now lost the equivalent of roughly 280 classrooms of students since 2020, the question is no longer whether the decline will stop. It is whether the system can restructure around the enrollment it actually has.
Detailed code that reproduces the analysis and figures in this article is available exclusively to EdTribune subscribers.
Discussion
Sign in to join the discussion.
Loading comments...