This is part of The MDEdTribune's series on Maryland's 2025-26 enrollment data.
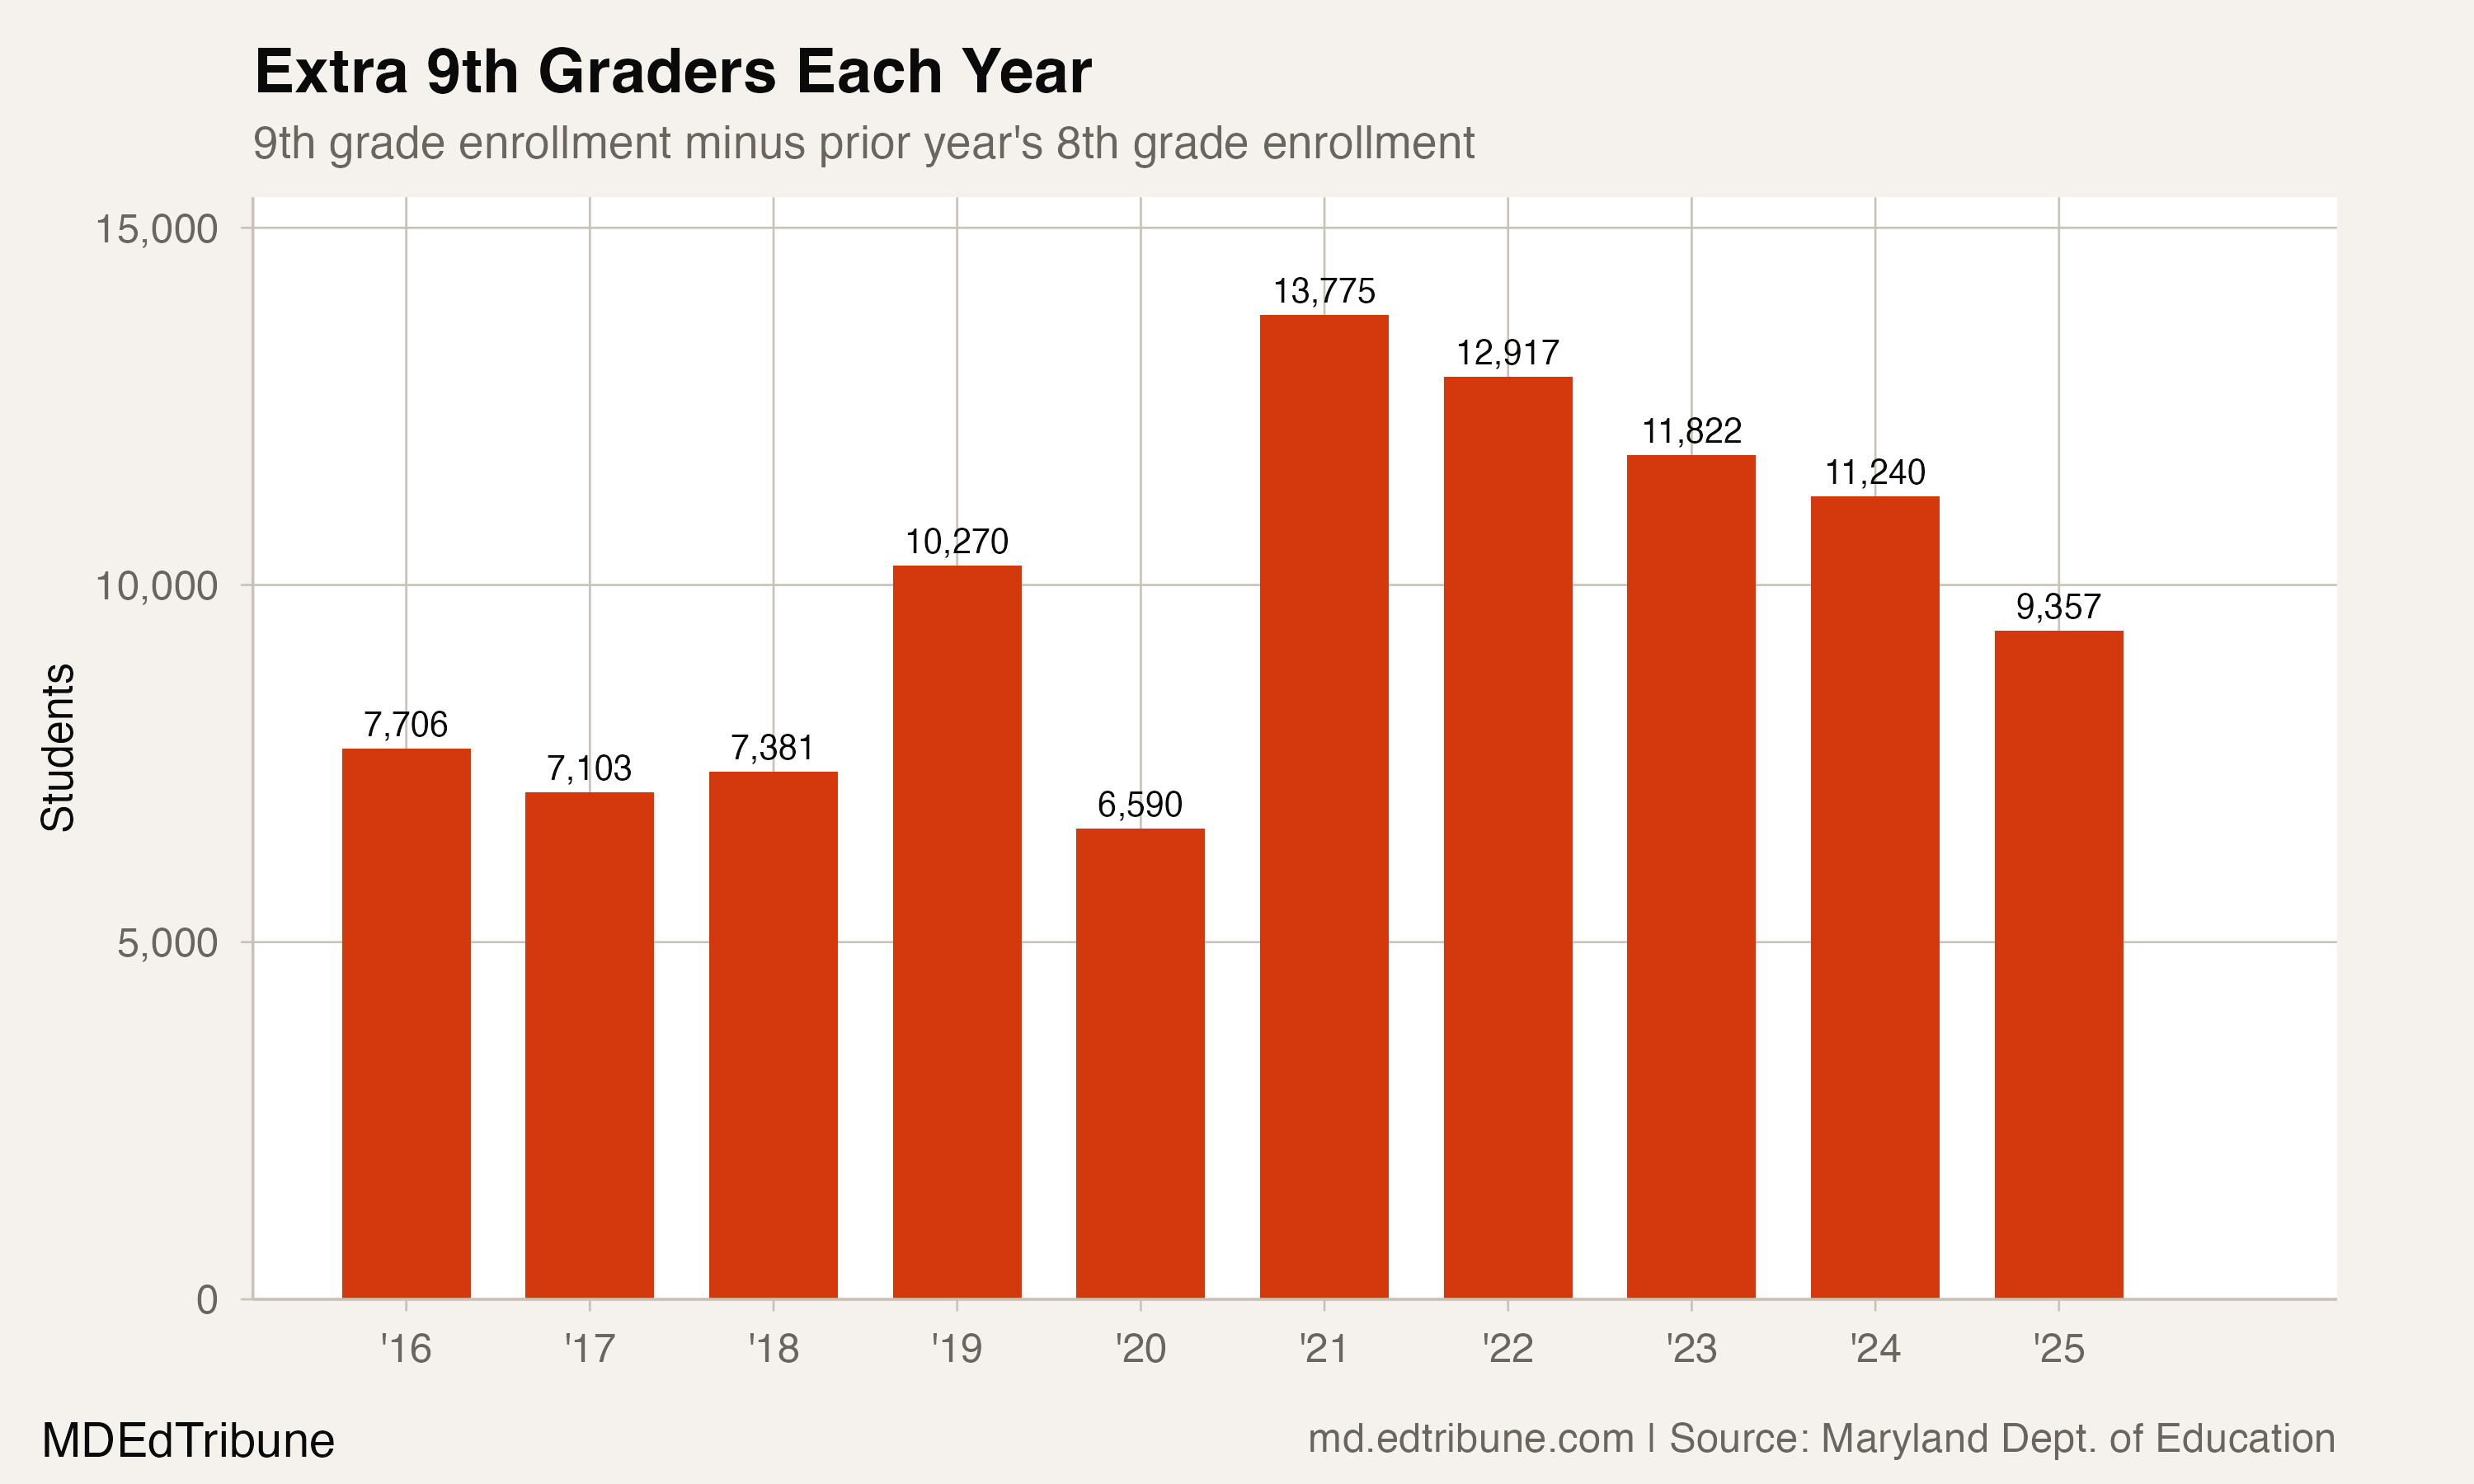
In a state where every other grade transition moves students forward in predictable numbers, one stands out. Maryland's 9th grade enrolled 75,813 students in 2025-26, 14.1% more than the 66,456 eighth graders who preceded them. That is 9,357 students who were not in Maryland's public middle schools the year before but appeared in its public high schools.
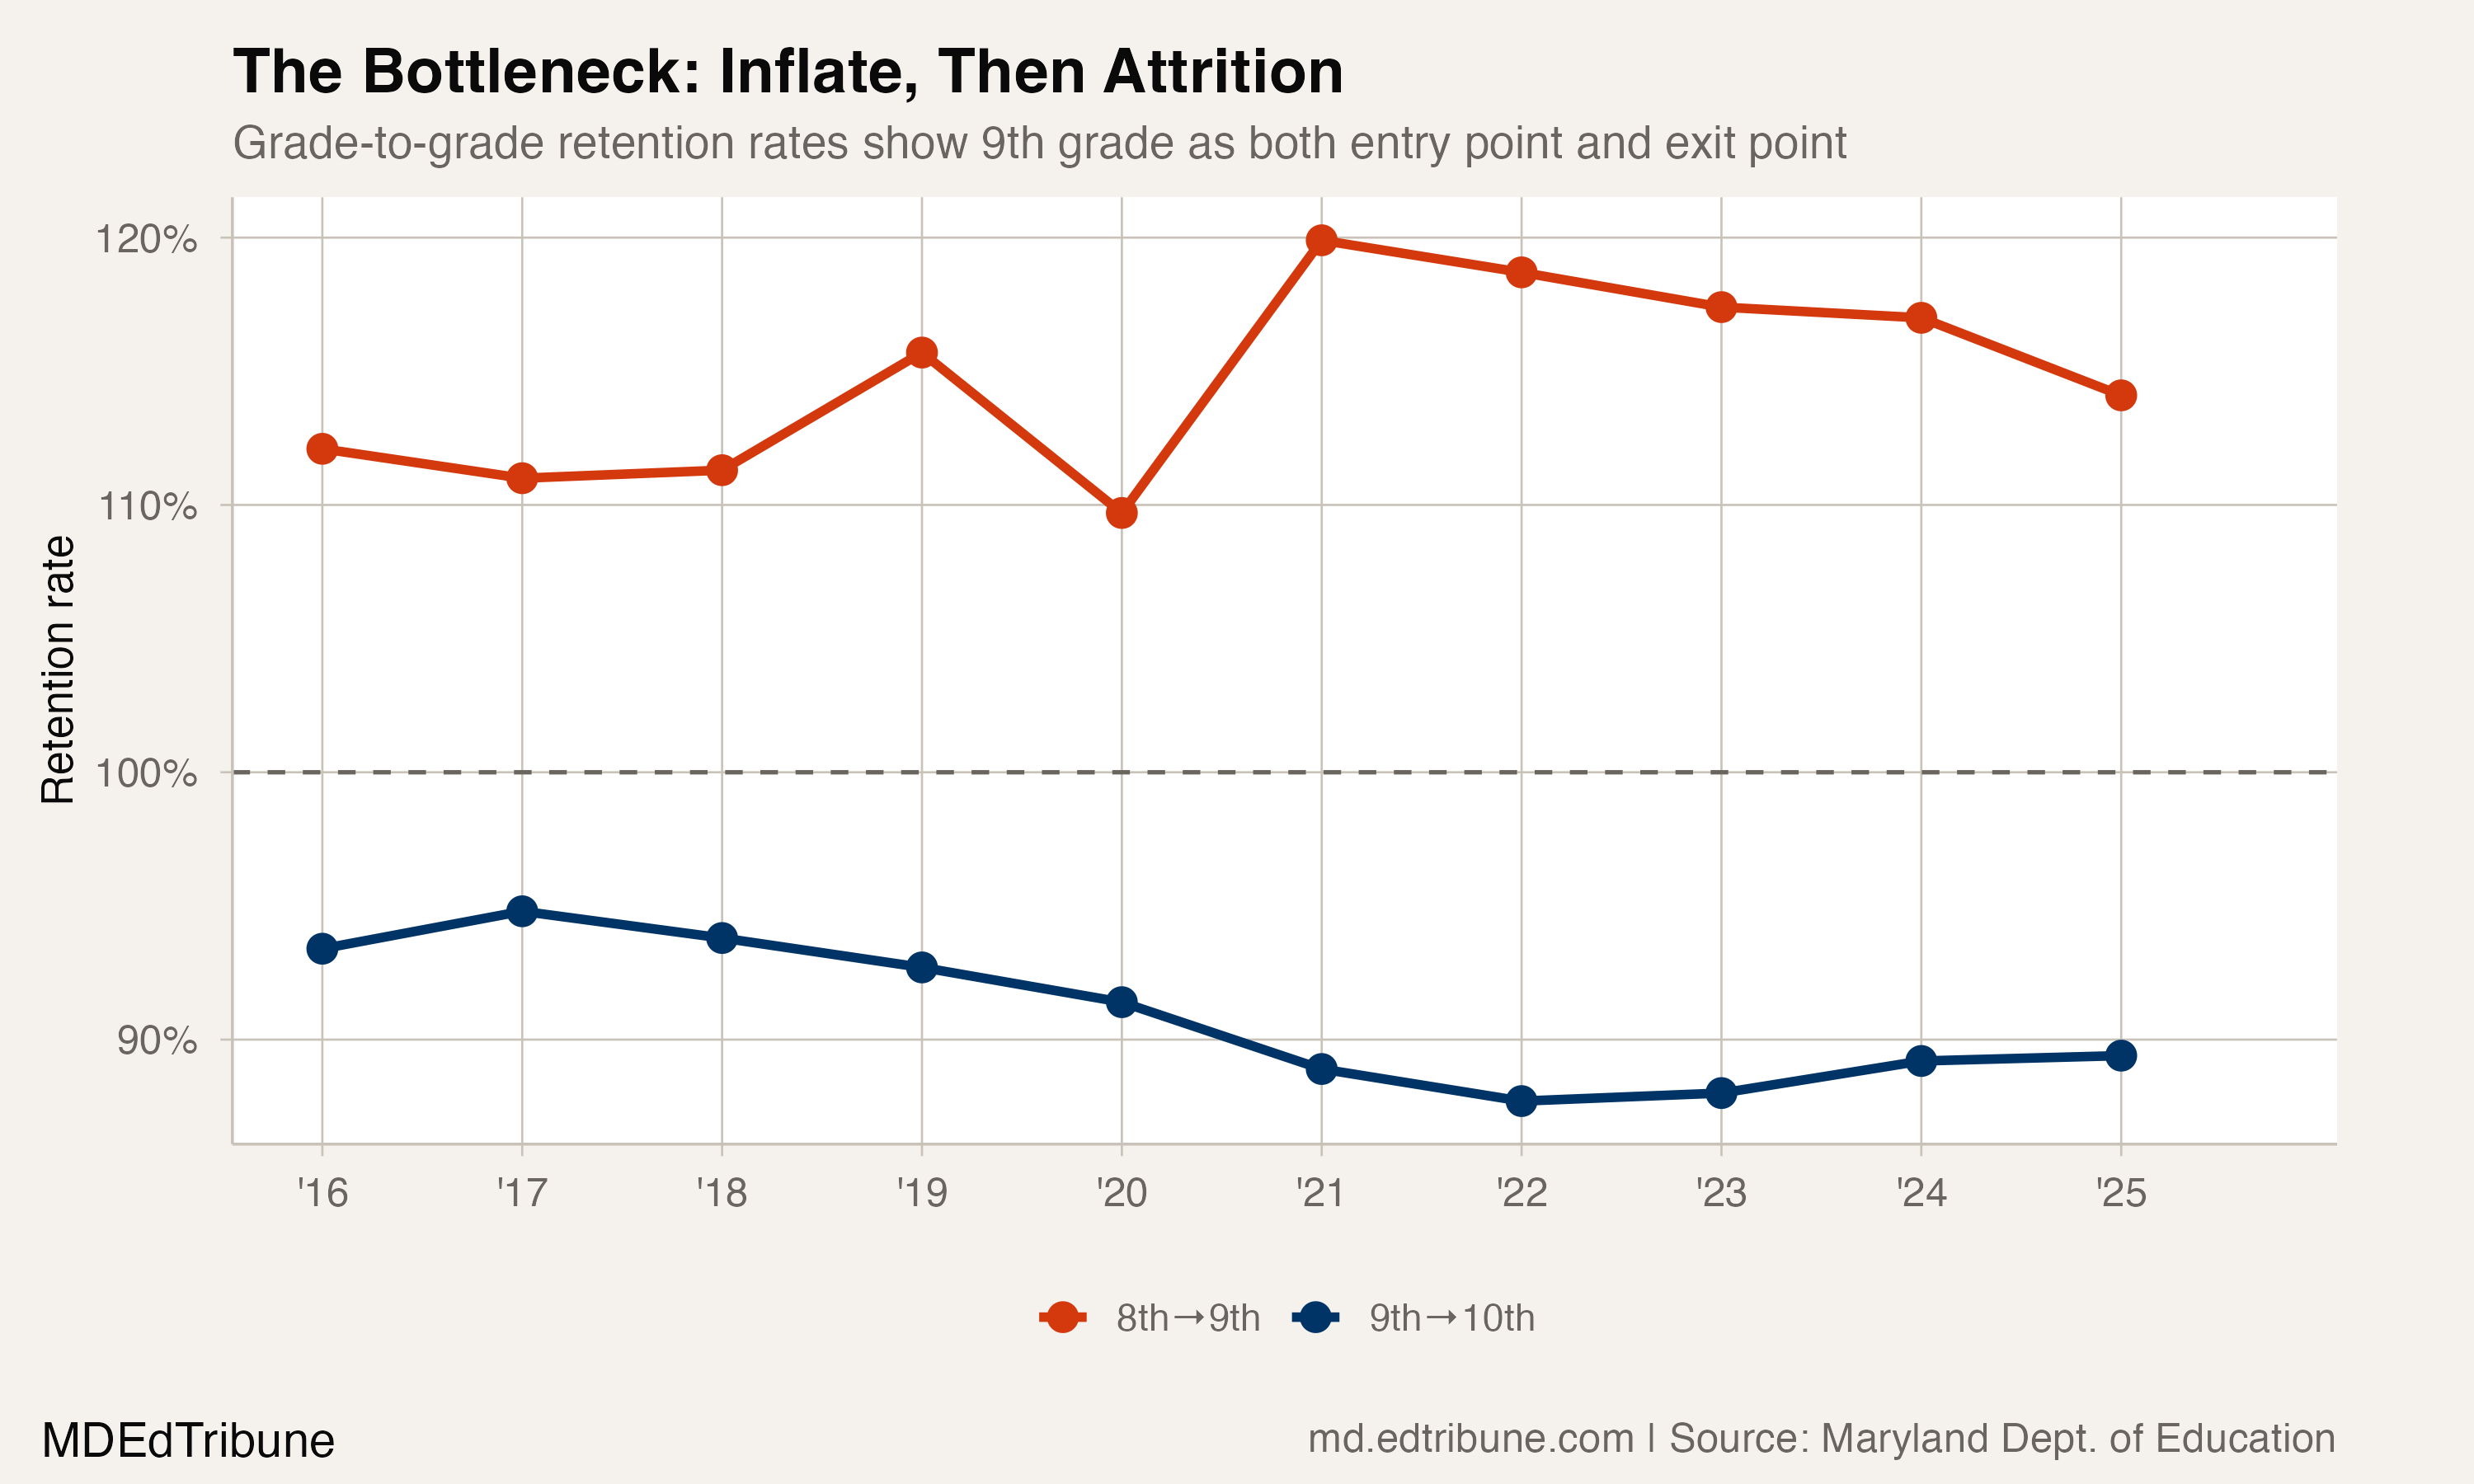
The pattern is not new. It is not a one-year anomaly. For every year in the dataset going back to 2016, Maryland's 9th grade class has been larger than the 8th grade class that fed it. The surplus has never dropped below 6,500 students and, during the pandemic, it swelled past 13,000.
The one transition that breaks the pattern
Look at the full pipeline of grade-to-grade transitions for the 2024-to-2025 school year and the 8th-to-9th jump is immediately visible. Every other step in the K-12 progression hovers between 99% and 103%. Kindergarten to 1st grade runs at 103.4%, reflecting students who delay kindergarten entry and enroll late. The 5th-to-6th transition, when students change buildings, holds at 99.7%. The 7th-to-8th transition is 101.0%.
Then comes 8th to 9th: 117.0%.
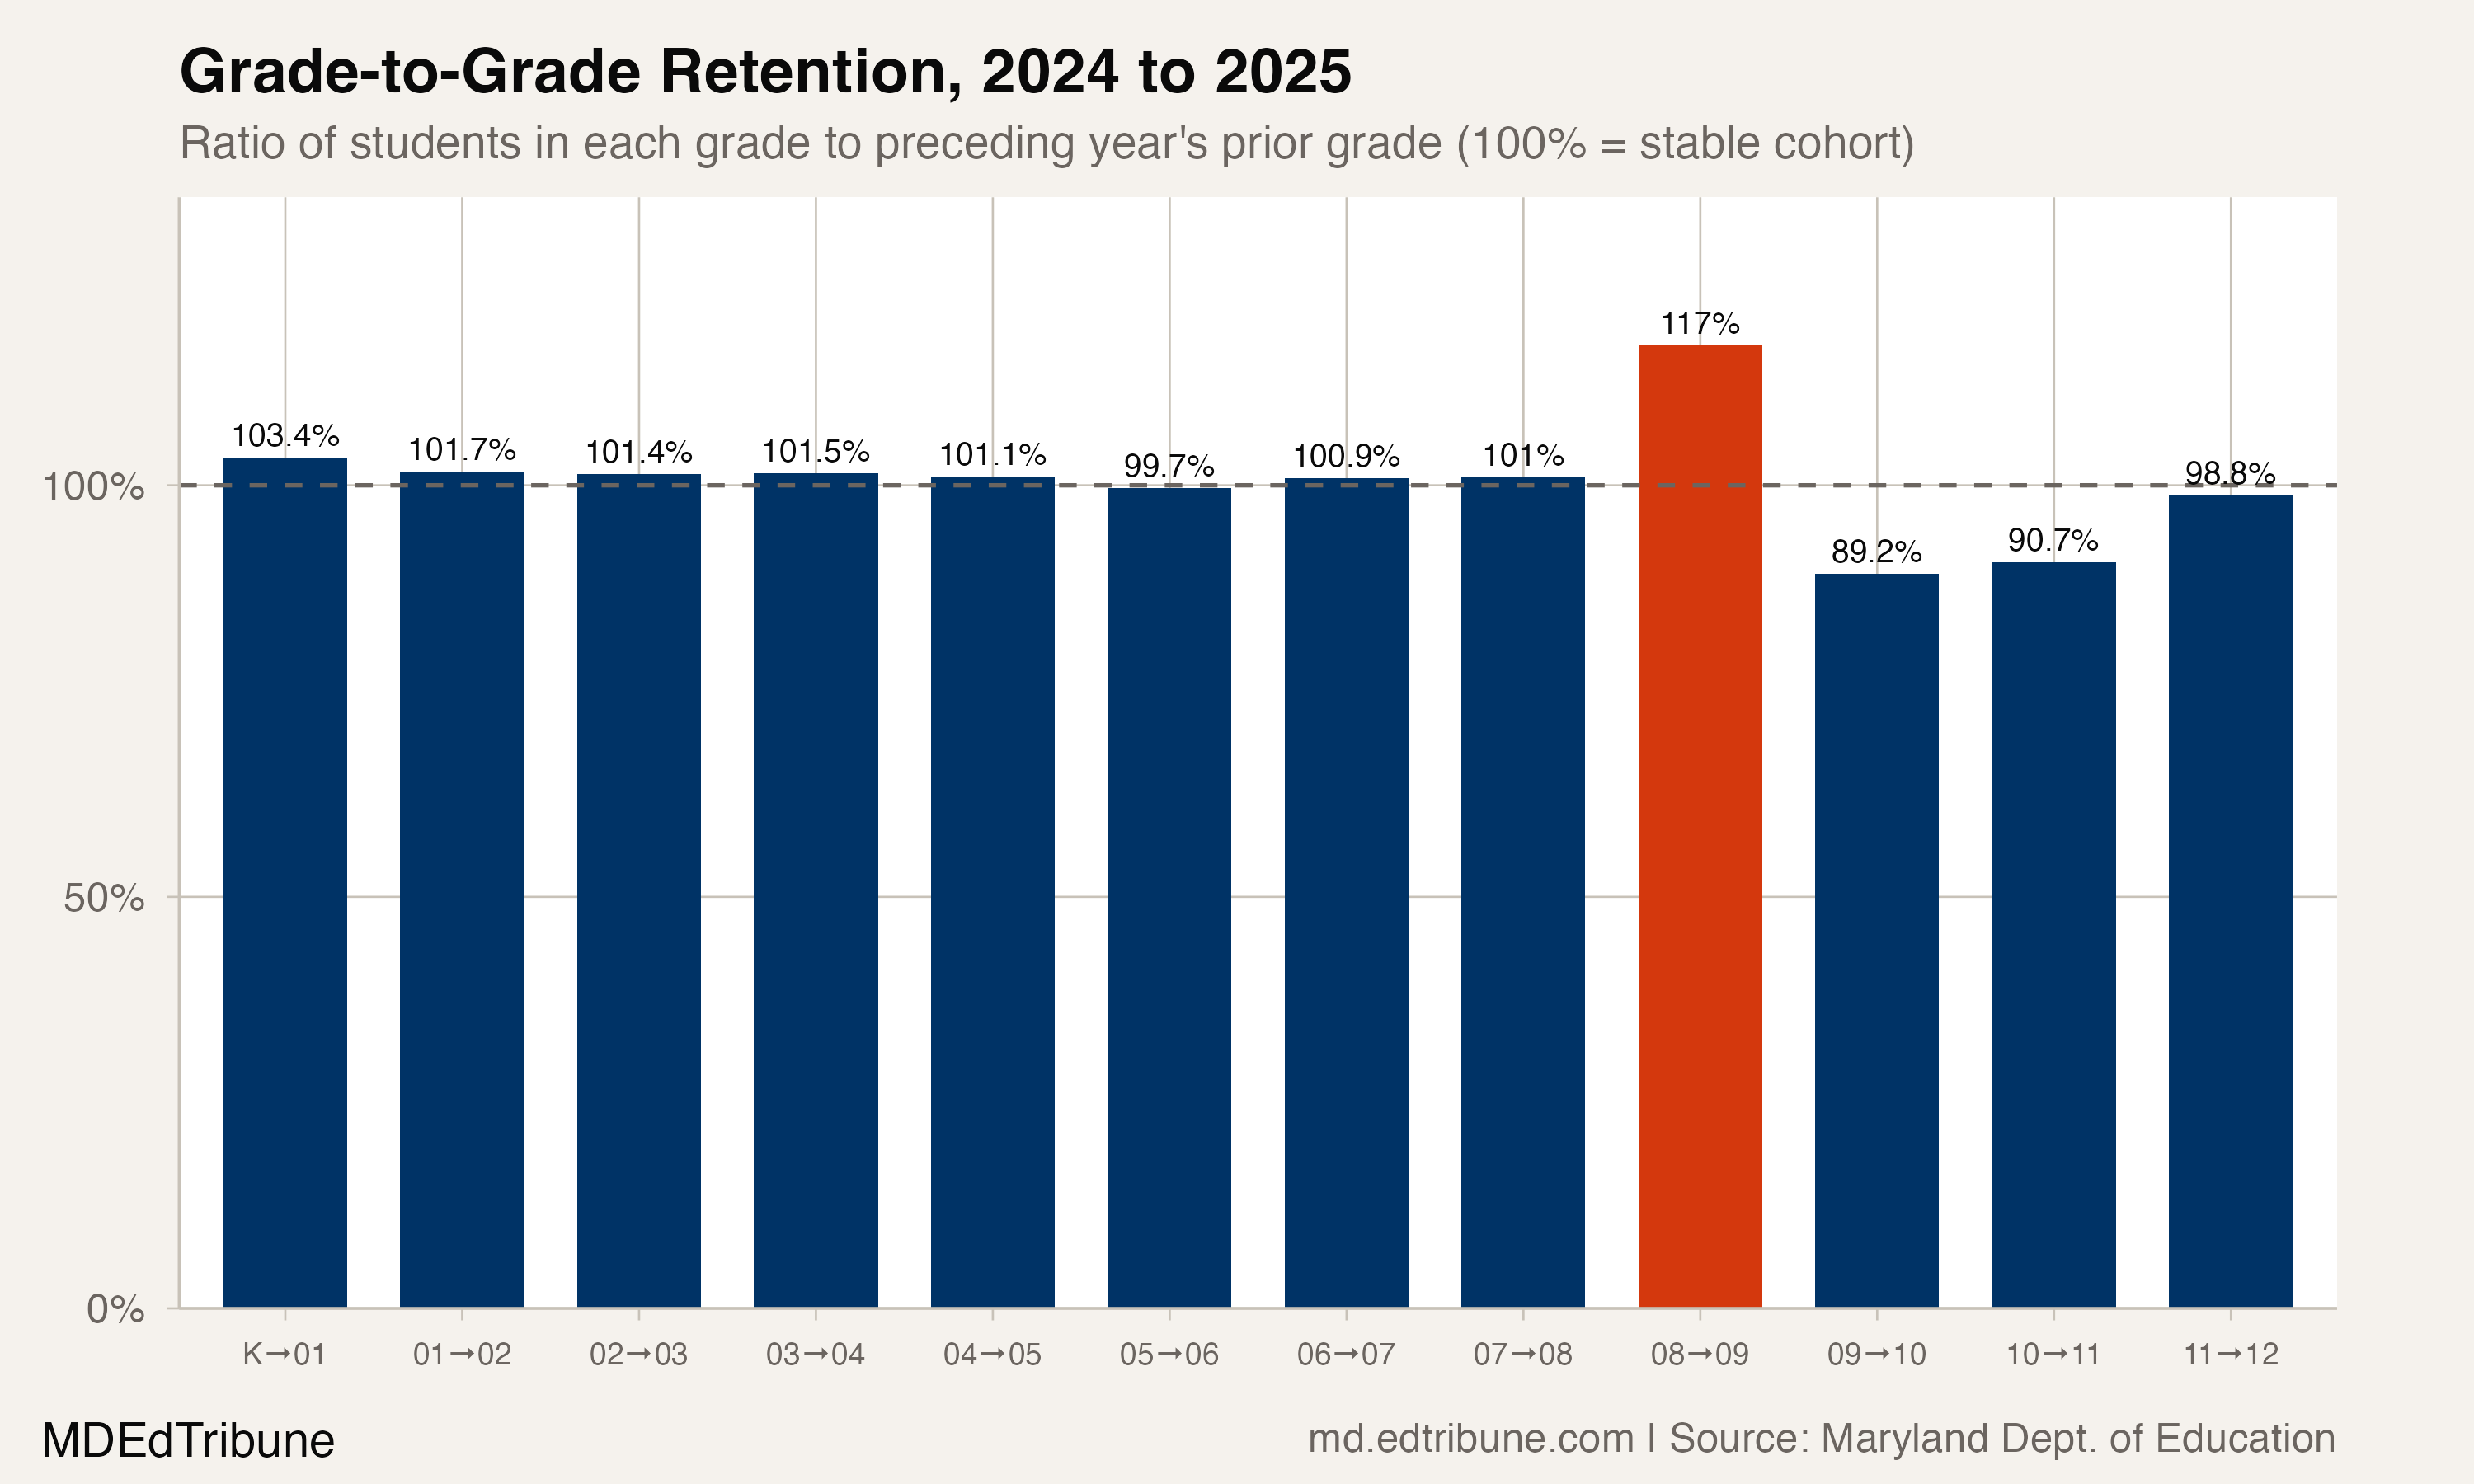
No other transition in the system comes close. The two transitions that follow it tell the rest of the story: 9th to 10th drops to 89.2%, and 10th to 11th is 90.7%. Students flood into 9th grade, and then they begin disappearing.
A decade of surplus freshmen
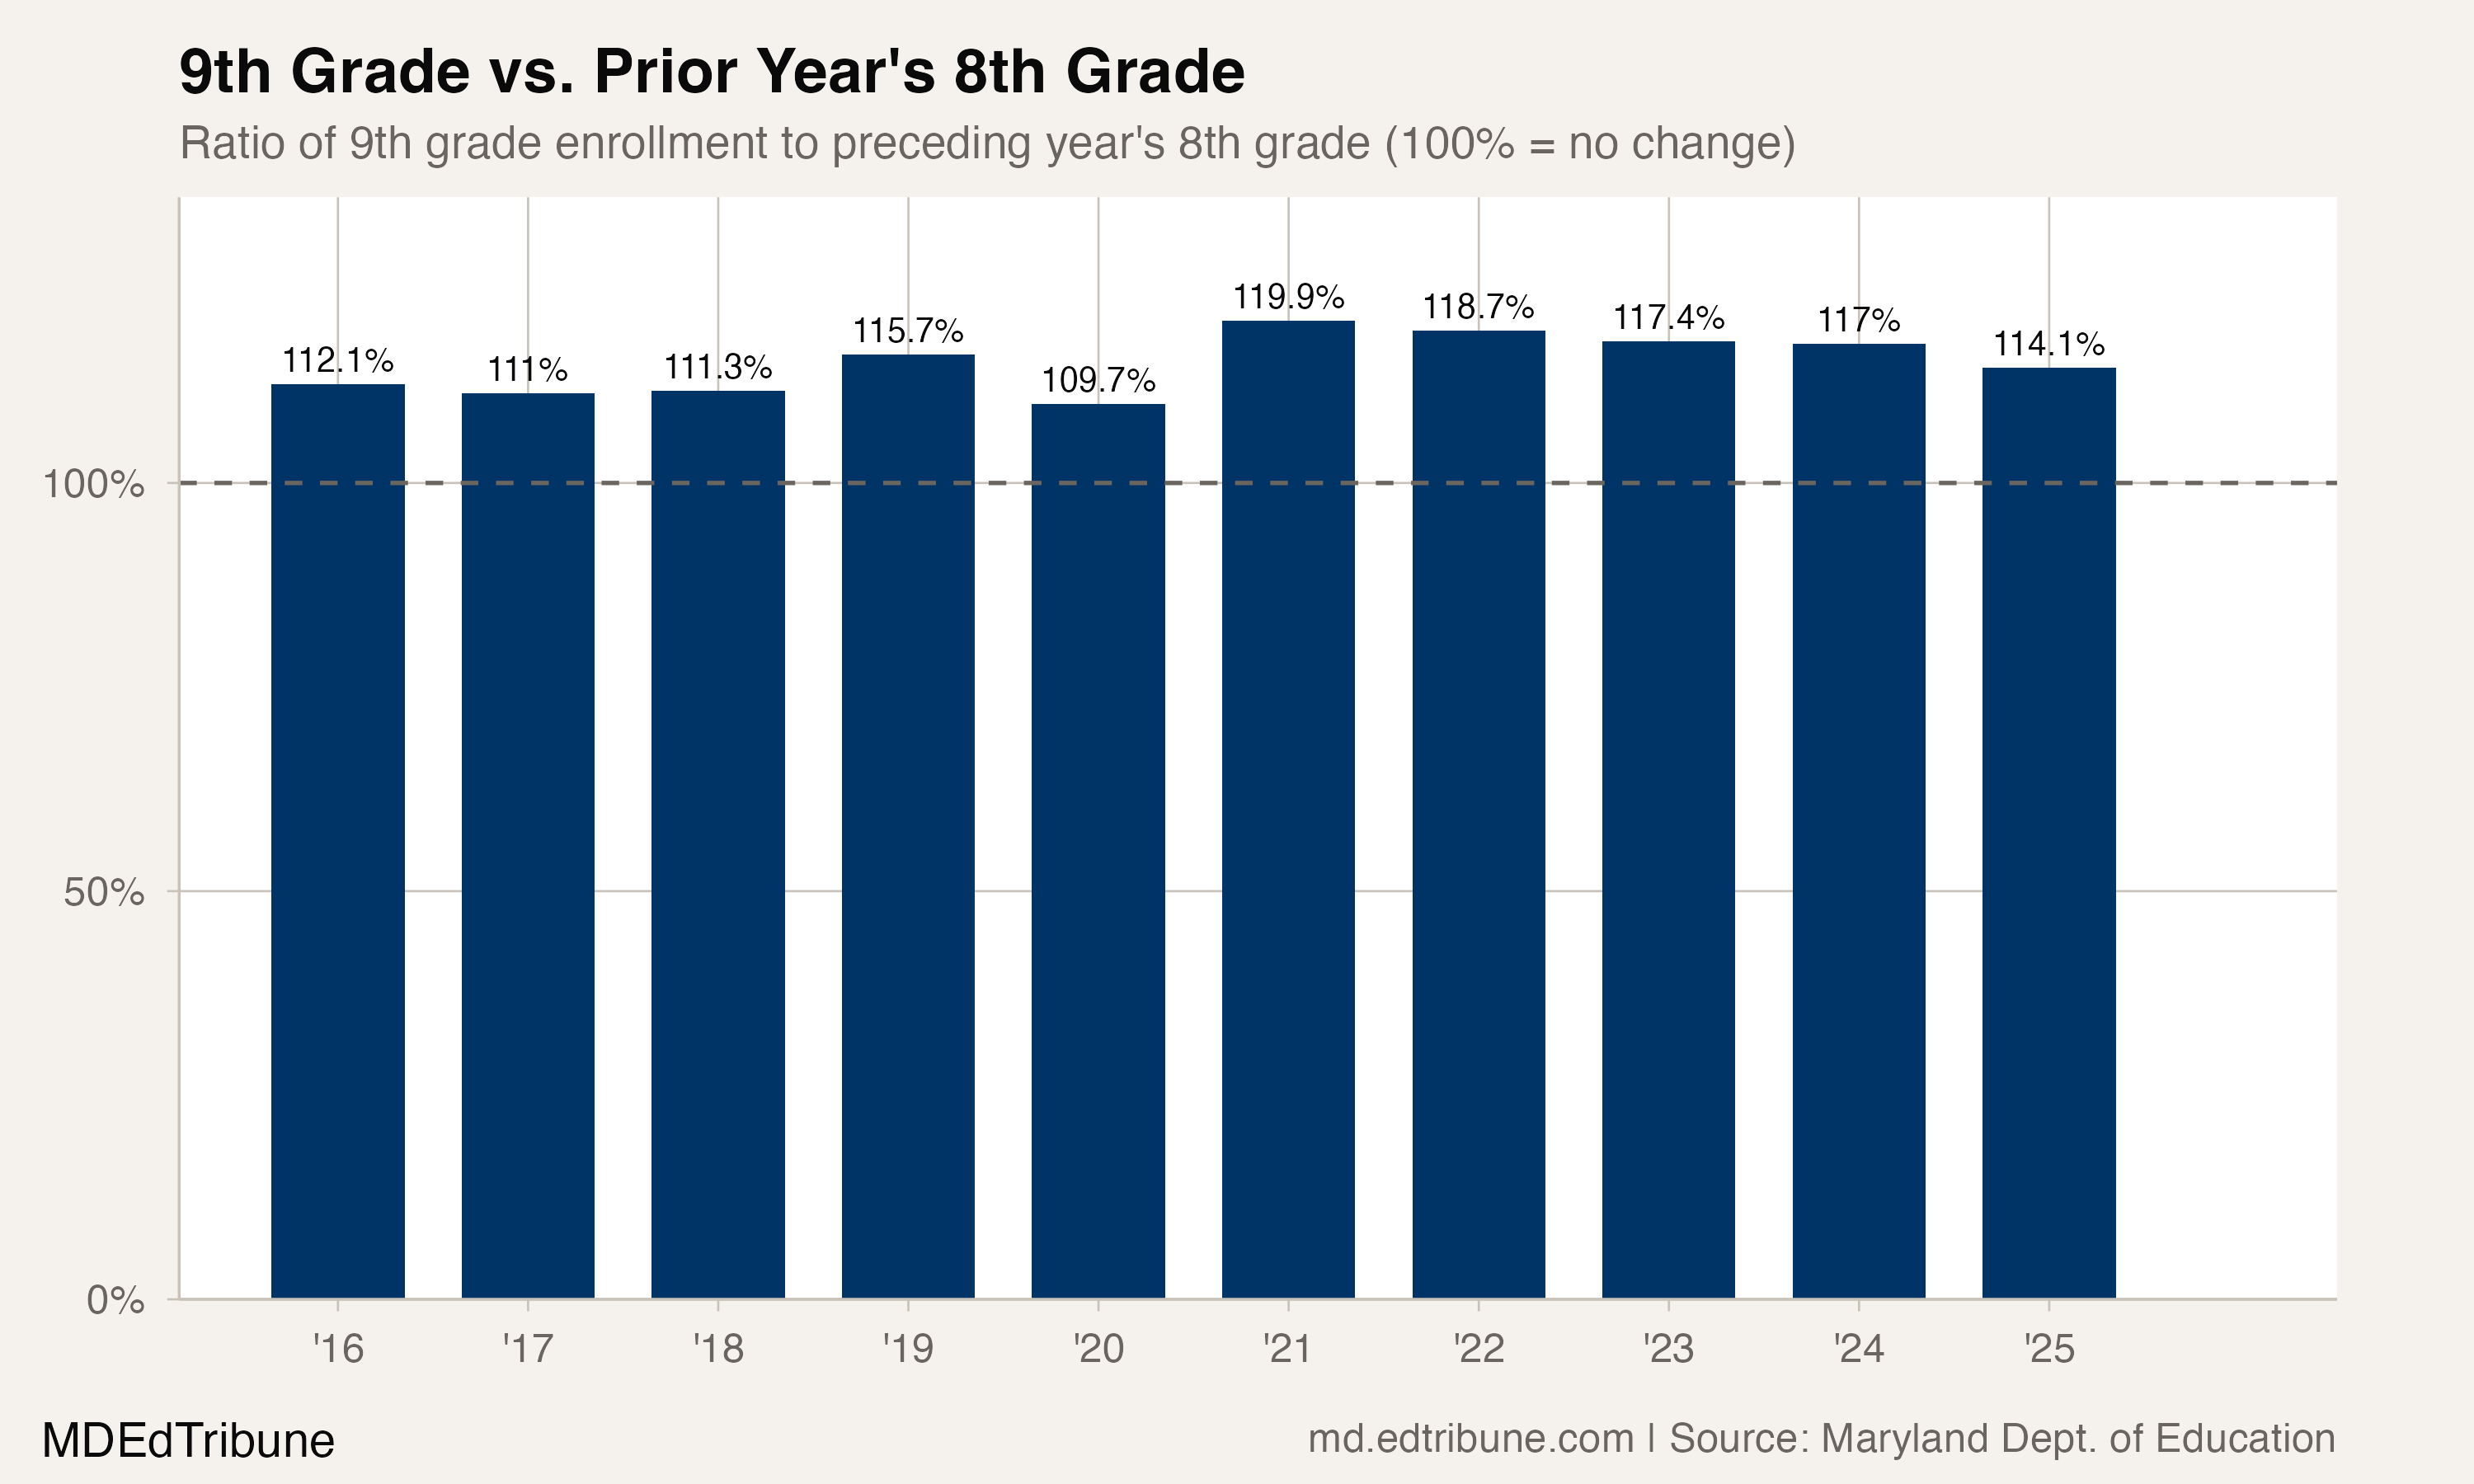
Over the past 10 years, the 8th-to-9th grade ratio has ranged from 109.7% (2020) to 119.9% (2021). The pre-pandemic average, from 2016 to 2019, was 112.5%. After COVID-19, the ratio jumped to nearly 120% and has remained elevated, sitting between 114% and 119% every year since.
In absolute terms, the surplus has totaled 98,161 students across the decade, an average of 9,816 per year. The 2021 peak produced 13,775 extra 9th graders in a single year.
Where the bulge is largest
The 9th grade bulge is not uniform across Maryland's 24 school districts. In 2025, Dorchester↗ET County had the highest ratio at 137.2%, with 123 more 9th graders than it had 8th graders the year before. Talbot↗ET County followed at 131.5%.
But the largest absolute numbers come from Maryland's urban and inner-suburban districts. Baltimore City↗ET added 1,645 extra 9th graders (130.8%), Montgomery County↗ET added 2,585 (121.4%), and Prince George's County↗ET added 1,960 (119.9%). Baltimore County↗ET added 1,327 (116.4%).
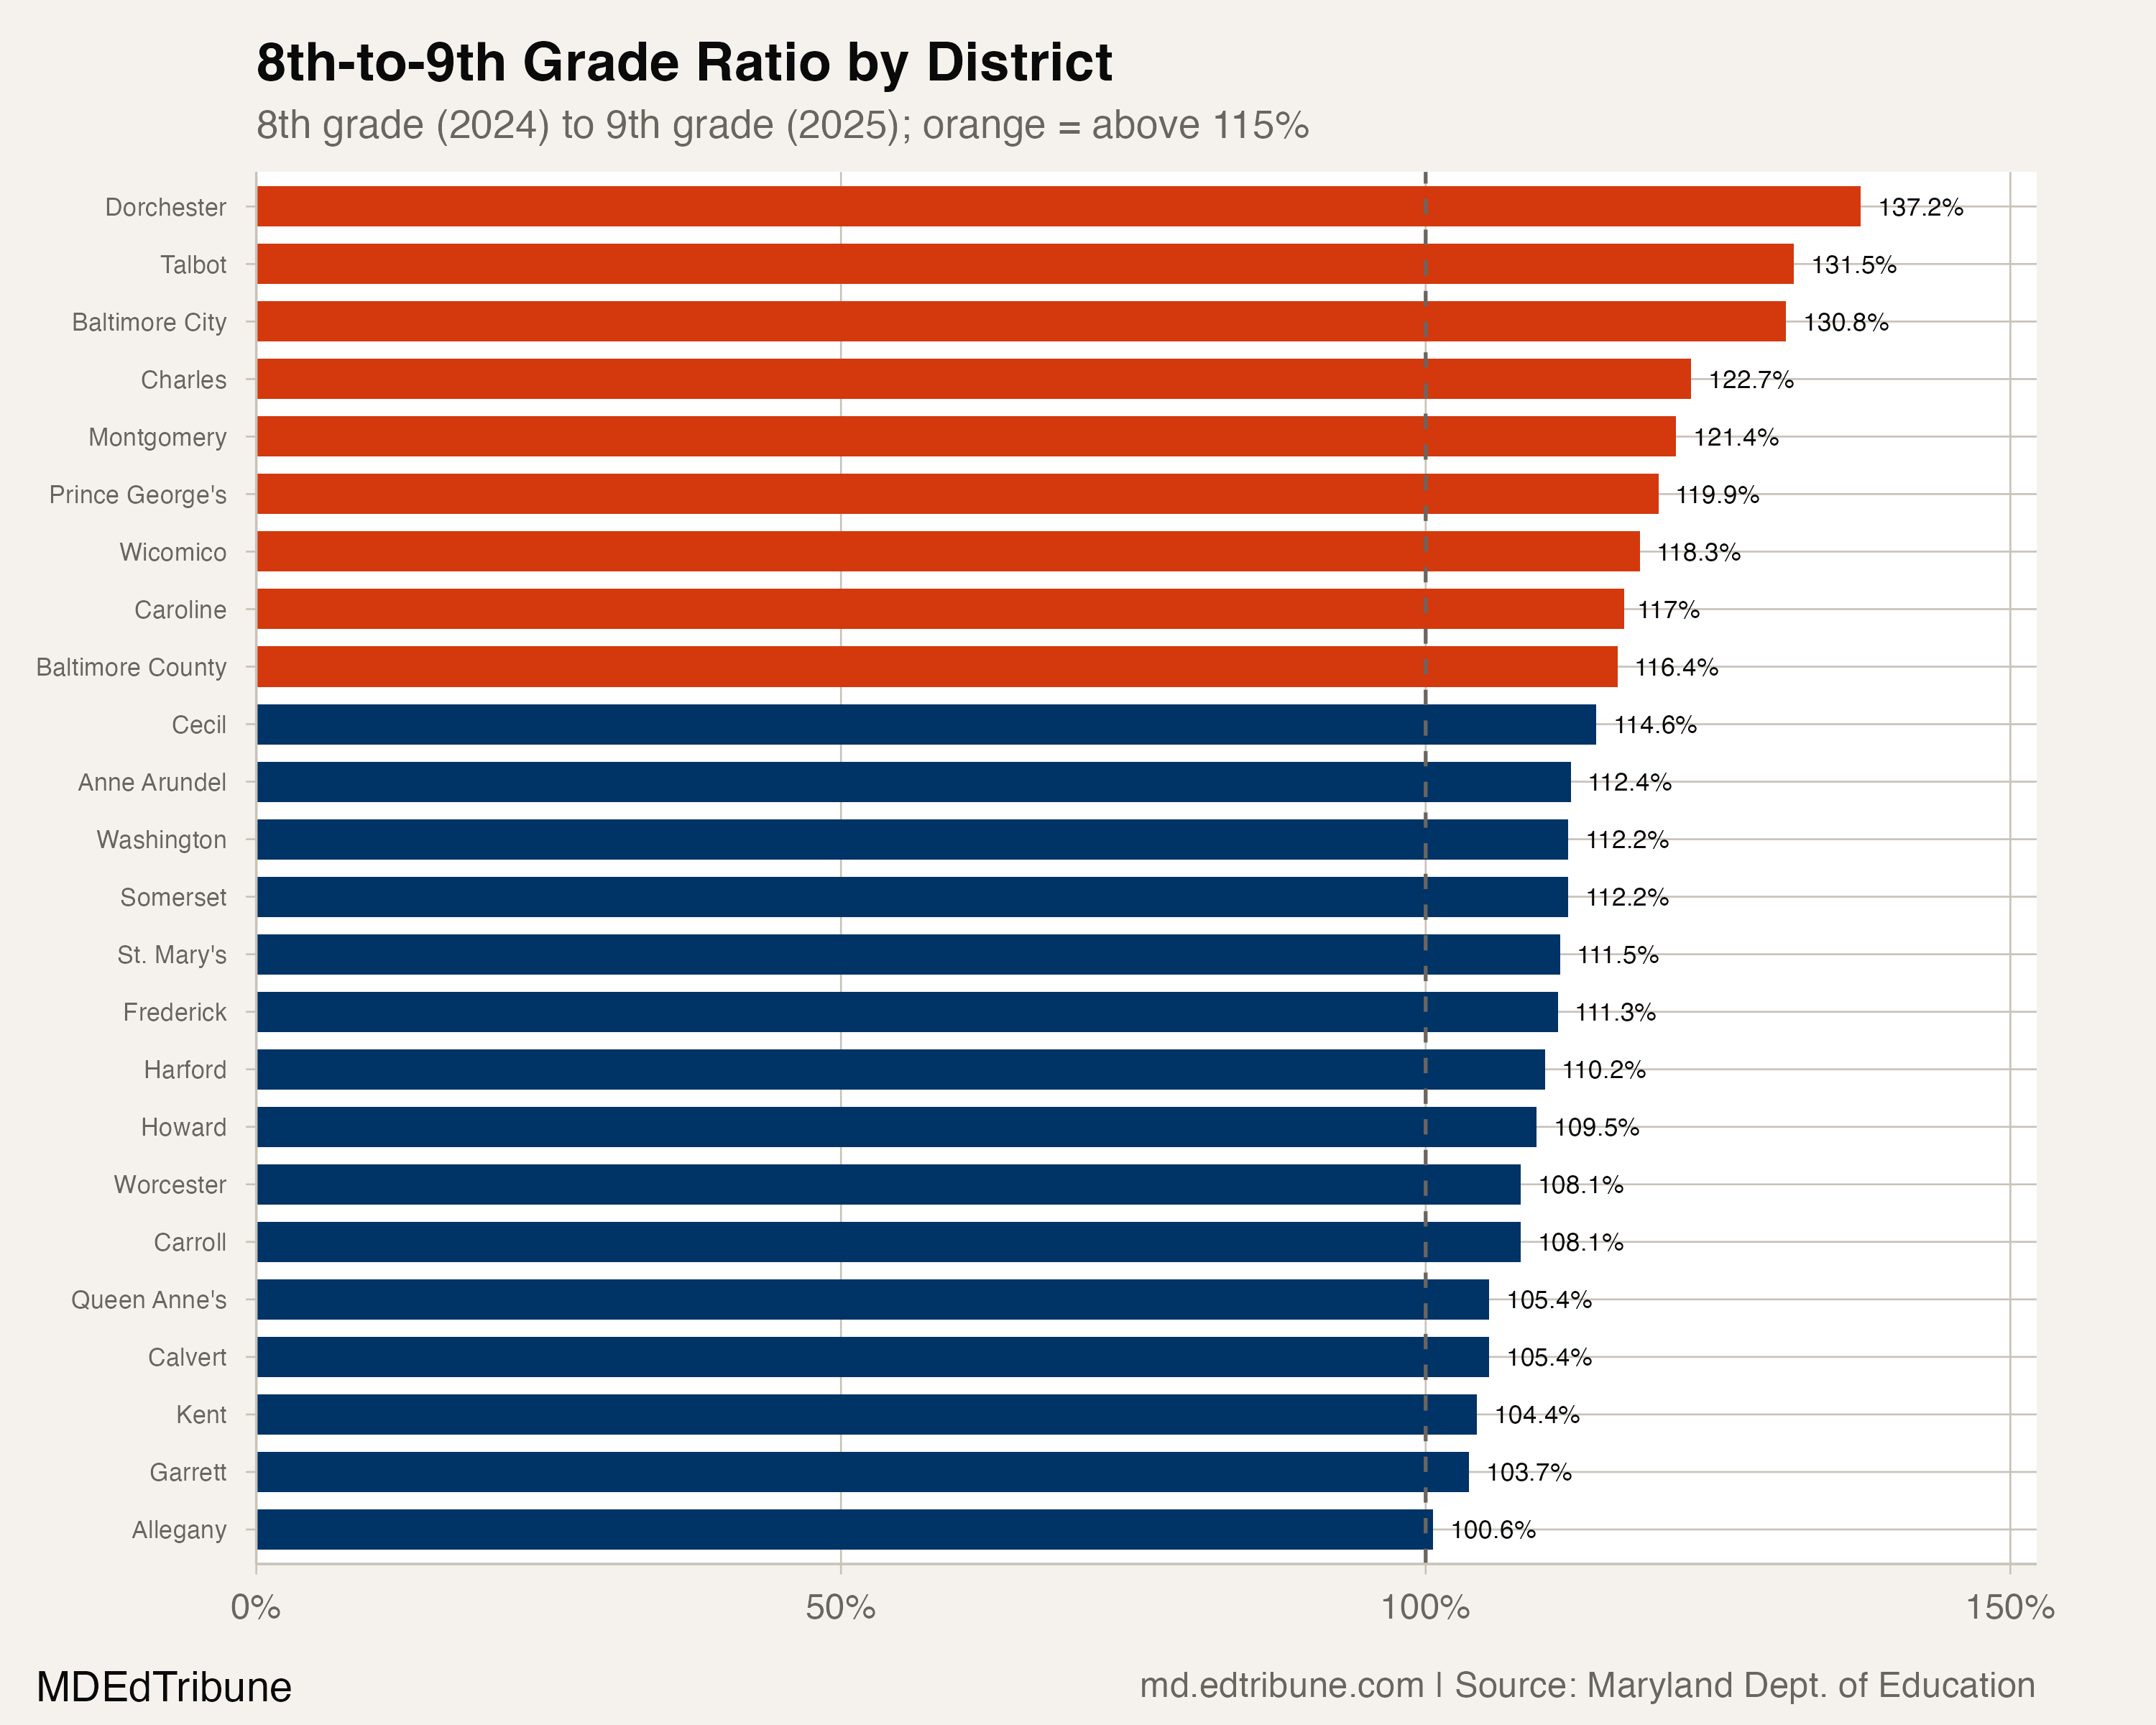
At the other end, Allegany↗ET County barely registered a bulge at all: 100.6%, just four extra students. Garrett County (103.7%) and Kent County (104.4%) were similarly flat. These are small, rural districts where private school options are limited and interstate migration is minimal.
The geographic pattern is revealing. Districts adjacent to Washington, D.C. and the Baltimore metro area show the largest bulges, consistent with students transferring from private K-8 schools into public high schools or families moving across state lines at the high school transition point.
What produces 9,000 extra freshmen
Three mechanisms can inflate 9th grade enrollment beyond what the 8th grade cohort produces, and Maryland's data is consistent with all three operating simultaneously.
The first is grade retention. Students who fail to earn enough credits to advance to 10th grade are counted again as 9th graders the following year. Nationally, approximately one in five students repeats 9th grade, according to research cited by the National Center for Education Statistics. A 2005 study by Boston College researchers Anne Wheelock and Jing Miao documented that the national 9th grade bulge had tripled from 4% in 1970 to 13% by 2000, driven by rising standardized testing requirements and stricter graduation standards.
The second is private-to-public transfer. Maryland has a large nonpublic school sector. Many private and parochial schools in the state operate K-8 programs, meaning their students naturally enter public high schools at 9th grade. This transfer pattern would be particularly strong in Montgomery County, Prince George's County, and the Baltimore region, where private school density is highest.
The third is interstate migration. Maryland shares borders with Virginia, Pennsylvania, Delaware, and the District of Columbia. Families who relocate for high school, or whose children commuted across state lines for middle school, would enter the count at 9th grade. The concentration of the bulge in D.C.-adjacent districts lends some plausibility to this explanation, though no state-level data tracks the origin of incoming 9th graders.
Baltimore City's outsized bulge, consistently above 120% and peaking at 147.9% in 2021, likely reflects a stronger role for grade retention than transfer. The district's high school dropout rate hit 20.8% in 2025, a 15-year high and a 67% increase since 2021.
What reporting suggests
The pandemic amplified the bottleneck nationally. The 74 Million reported in 2022 that retention rates had doubled in some states and districts after COVID-era remote learning left students without enough credits to advance:
"Students were in ninth grade, and the COVID situation was so tough that more of them than usual didn't earn enough credits to be considered 10th graders yet." — The 74 Million, 2022
In Houston, the article noted, 18% of 9th graders repeated the year, up from a pre-pandemic rate of 10%. Maryland's data is consistent with a similar dynamic: the statewide ratio jumped from 109.7% in 2020 to 119.9% in 2021, the largest single-year increase in the dataset.
In Baltimore City, the consequences have been visible. Per-pupil spending rose from $17,320 in 2021 to $23,147 in 2025, according to Fox Baltimore, yet the dropout rate surged simultaneously. The district launched credit recovery programs in 2022 to help students who had fallen behind, but the bulge persists.
The exit side of the bottleneck
The 9th grade bulge has a mirror image: attrition. In 2025, only 89.4% of 9th graders persisted to 10th grade the following year, meaning Maryland lost 8,212 students in the transition. That attrition rate has worsened over the decade, from 93.4% in 2016 to a low of 87.7% in 2022.
The two trends move in tandem. When the bulge grows, attrition follows. The 2022 cohort that entered 9th grade at 119.9% of the prior 8th grade saw only 87.7% continue to 10th grade. The implication is that many of the surplus students who enter 9th grade do not make it to 10th.
Tracked over four years, the pipeline narrows further. Of the 83,081 students who enrolled in 9th grade in 2021-22, only 64,391 were enrolled in 12th grade four years later. That is a 77.5% persistence rate, the lowest in the dataset. For context, the 2016 cohort persisted at 87.8%.
Maryland's enrollment data cannot distinguish retained 9th graders from transfer students or new arrivals. It cannot tell whether the students who vanish between 9th and 10th grade dropped out, transferred to private school, moved to another state, or earned a GED. The aggregate numbers reveal the shape of the problem without illuminating the lives inside it.
The funding question
Under the Blueprint for Maryland's Future, the state's $3.8 billion education funding overhaul, per-pupil foundation funding follows enrollment counts. An inflated 9th grade produces more funding for high schools in one year, then a deflated 10th grade produces less the next. For districts like Baltimore City, where the bulge adds over 1,600 students and the subsequent attrition loses roughly the same number, the fiscal whiplash is real. Staff hired for a surge of freshmen are not needed two years later.
The question this data cannot answer is which fraction of those 9,357 extra 9th graders represents a policy failure and which fraction represents a structural feature of how families use Maryland's school system. If private-to-public transfers account for half the bulge, the system is working as designed: families choose private education through middle school and public education for high school. If grade retention accounts for most of it, then 9th grade is functioning as a bottleneck where thousands of students stall and many eventually leave.
The 2026-27 school year will test whether the post-COVID elevation is finally receding. The ratio has fallen from 119.9% in 2021 to 114.1% in 2025, moving back toward pre-pandemic norms. Whether it returns to the 111% range of 2016-2018 or settles at a higher new baseline will say something about how permanently the pandemic reshaped Maryland's high school pipeline.
Detailed code that reproduces the analysis and figures in this article is available exclusively to EdTribune subscribers.
Discussion
Sign in to join the discussion.
Loading comments...