This is part of The MDEdTribune's series on Maryland's 2025-26 enrollment data.
A year before the 2025-26 count, half of Maryland's 24 school districts were adding students. In 2025-26, one was.
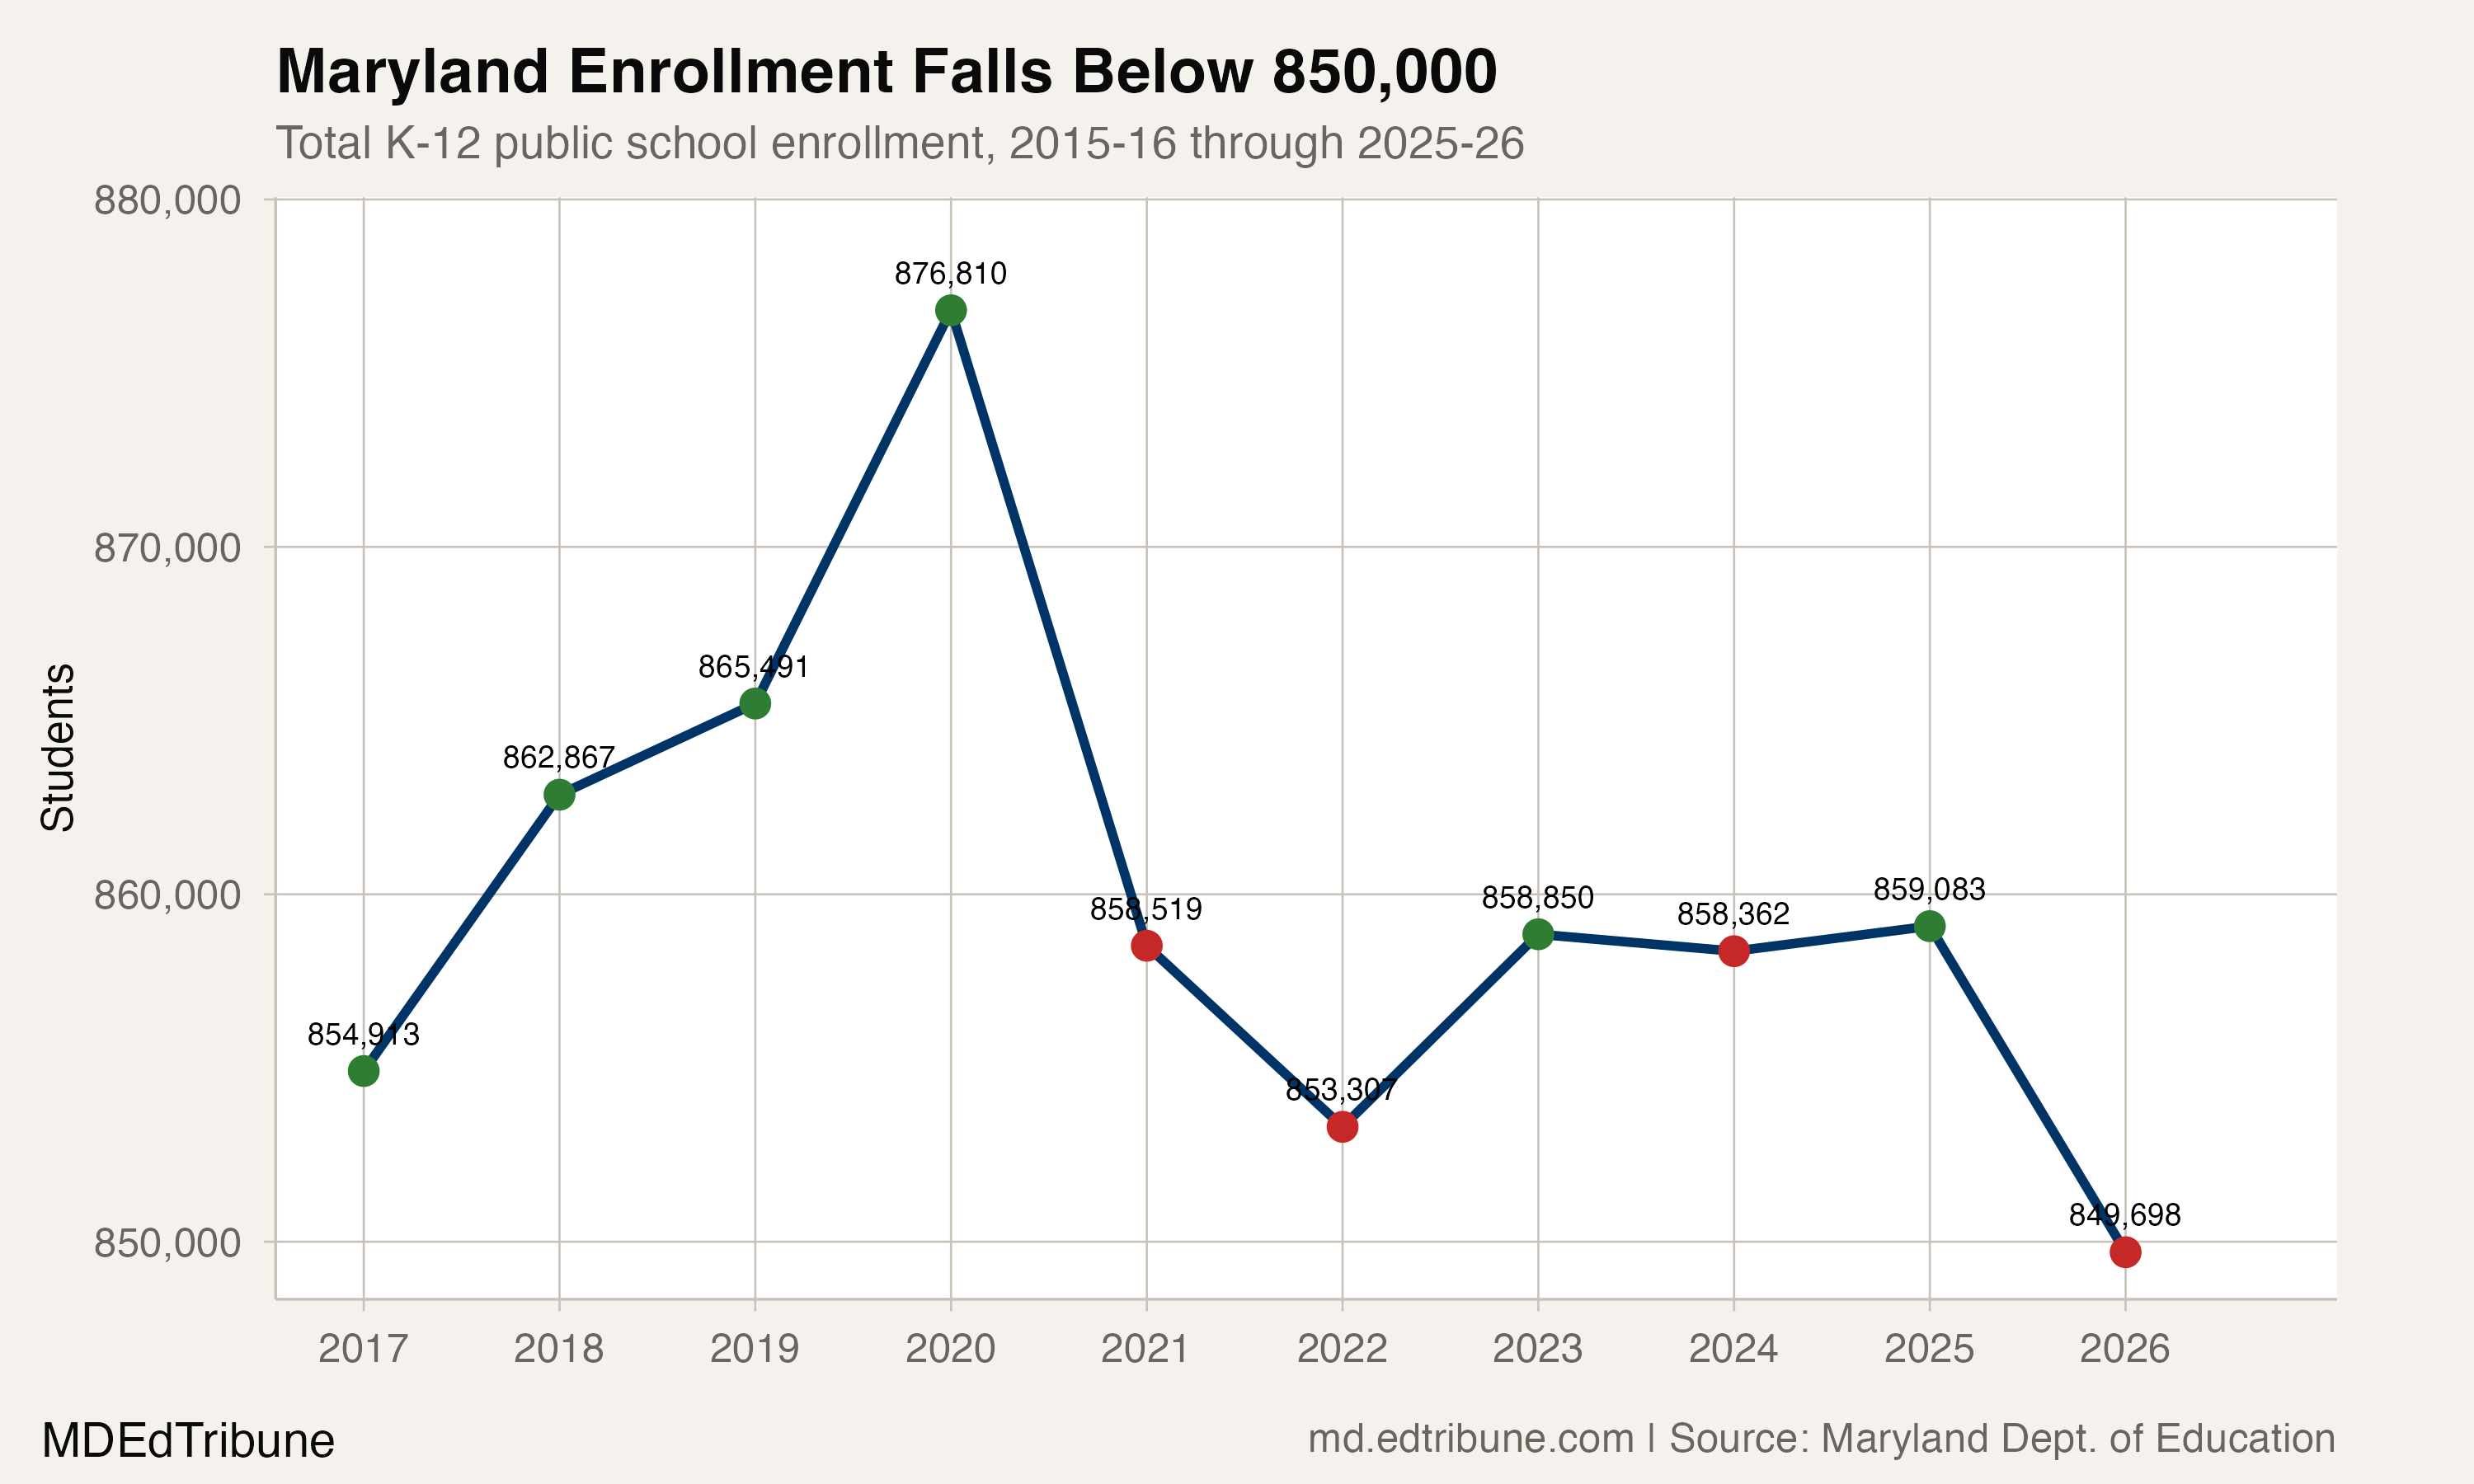
Twelve districts that grew in 2024-25 reversed direction in 2025-26, flipping from collective gains to collective losses. The state shed 9,385 students, a 1.1% decline that pushed total enrollment to 849,698. That is the steepest single-year drop since the pandemic year of 2020-21 and leaves Maryland just 1,532 students above where it started a decade ago.
Kent County↗ET, with 1,609 students, is the only district in the state that added enrollment in 2025-26. It gained 18 students after losing 30 the year before.
The reversal, district by district
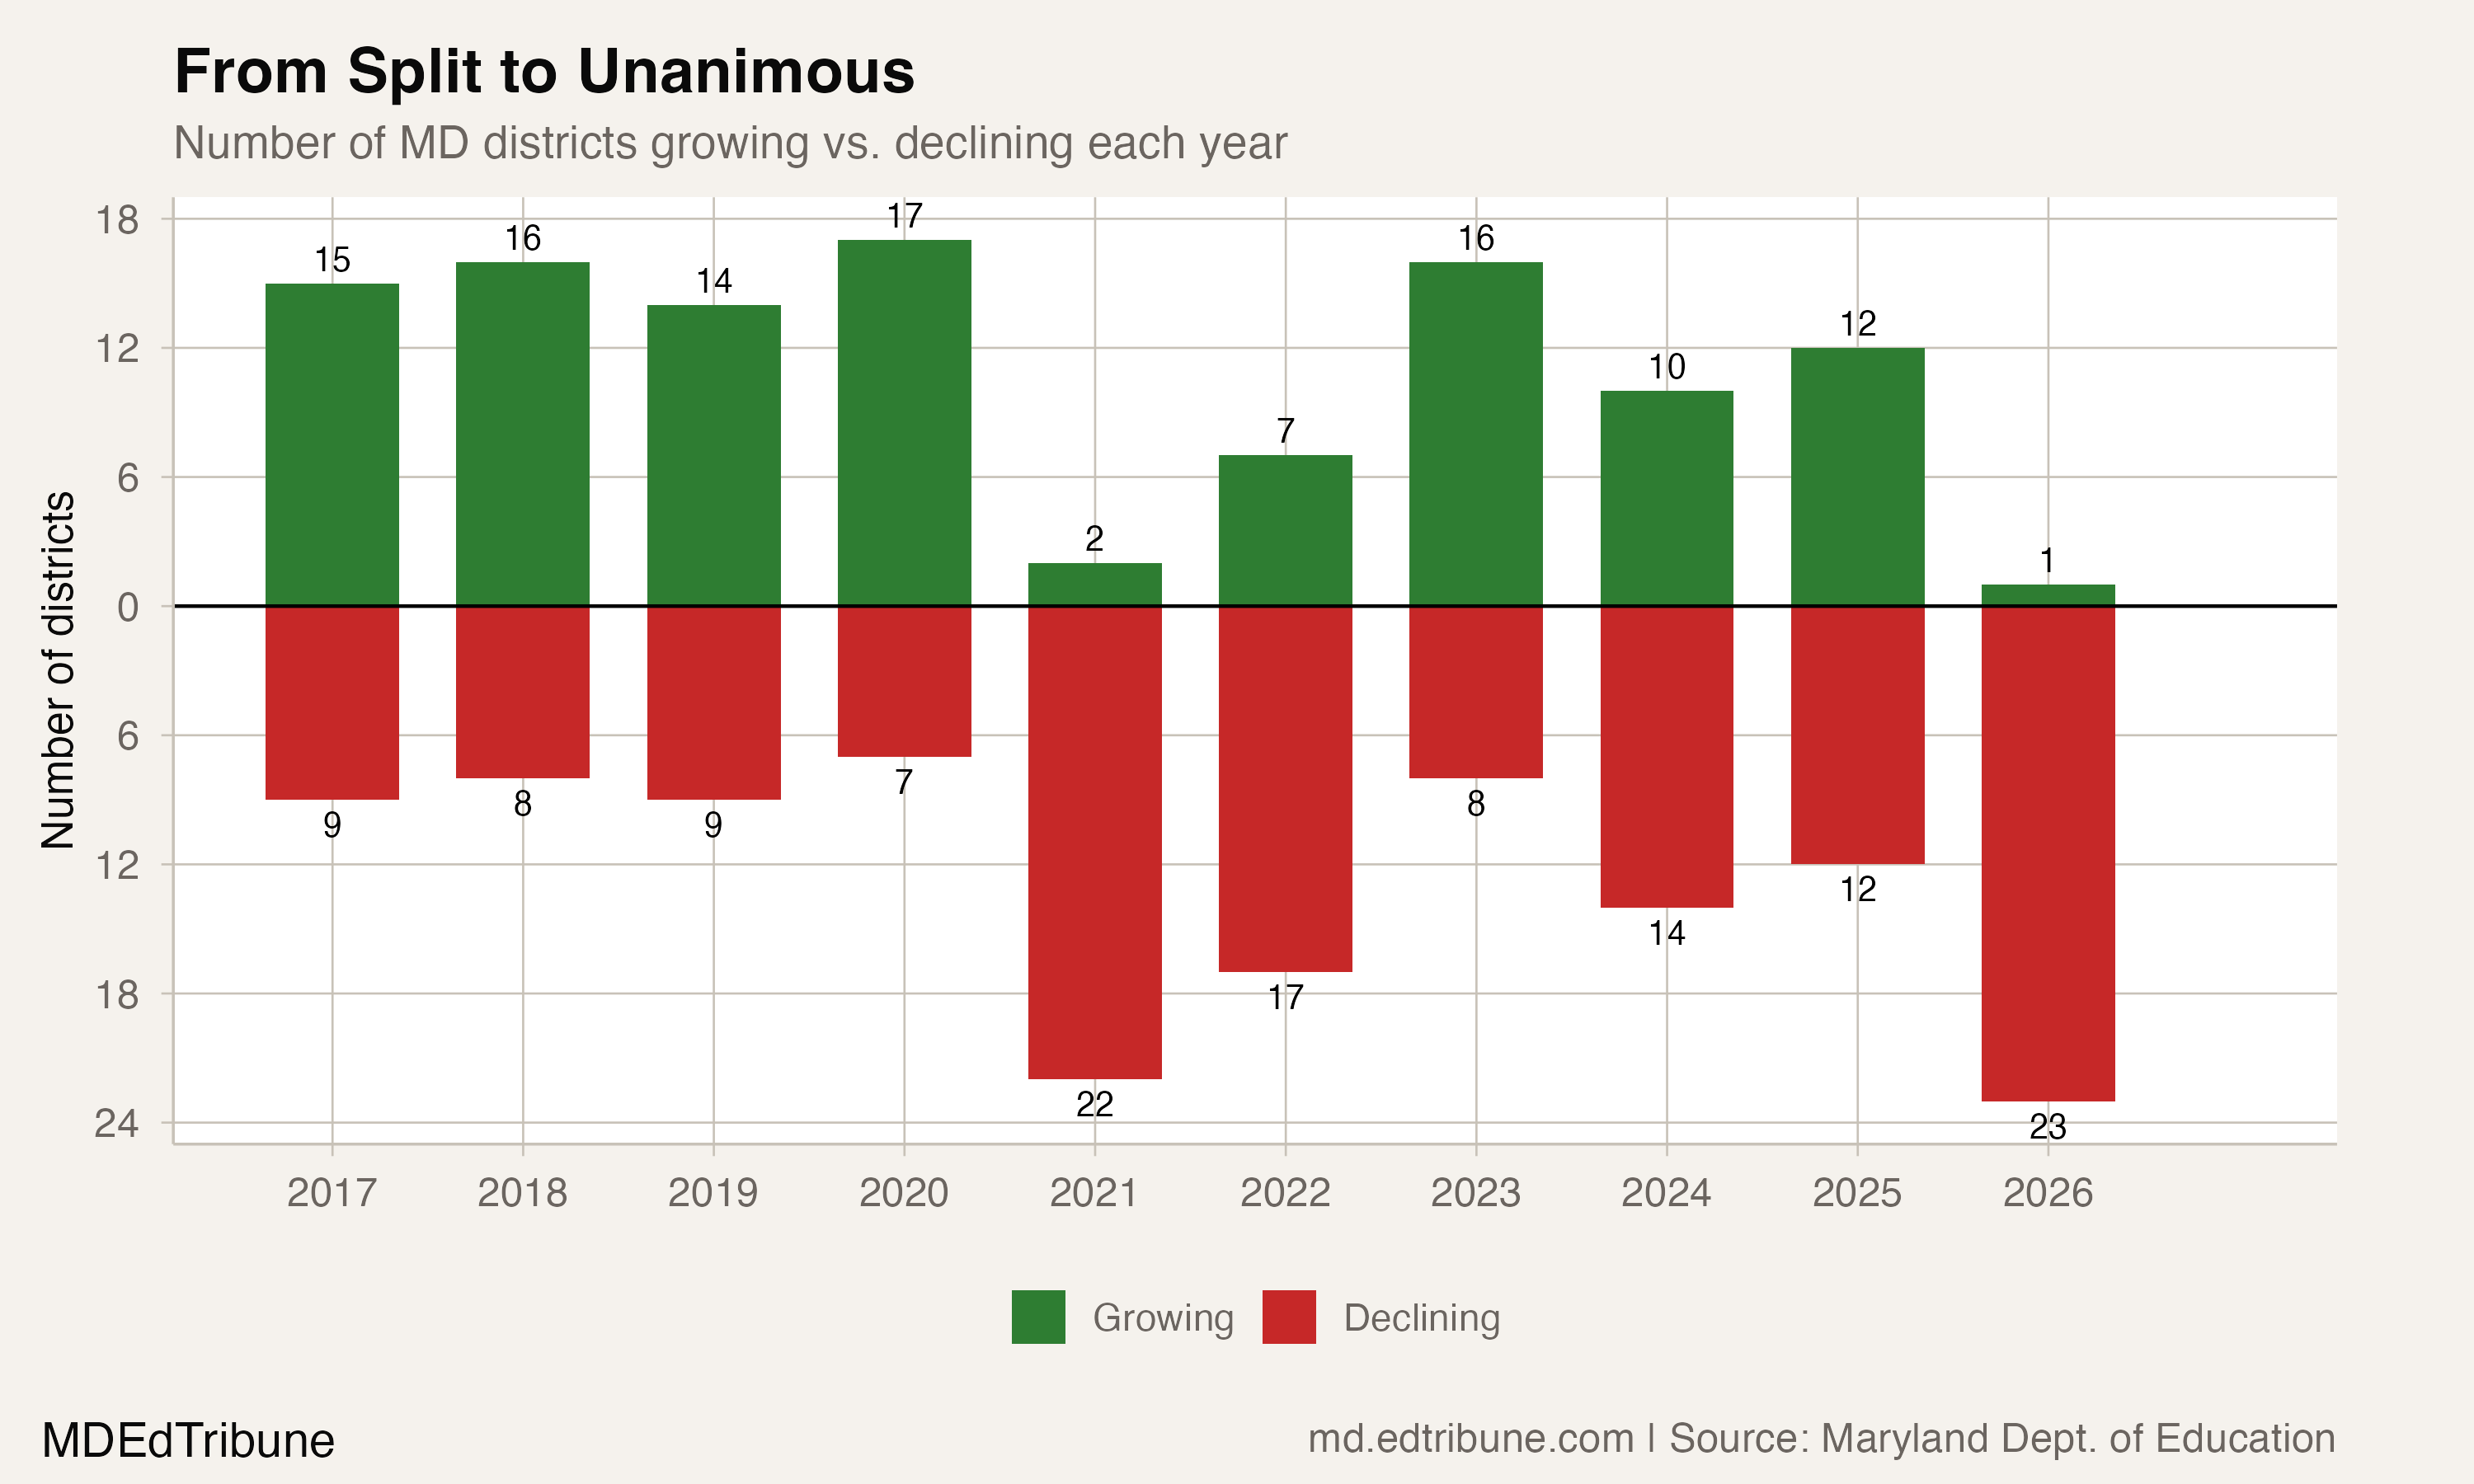
The scale of the flip is unusual. In 2024-25, the state was evenly split: 12 districts growing, 12 declining. By 2025-26, the split was 1-to-23.
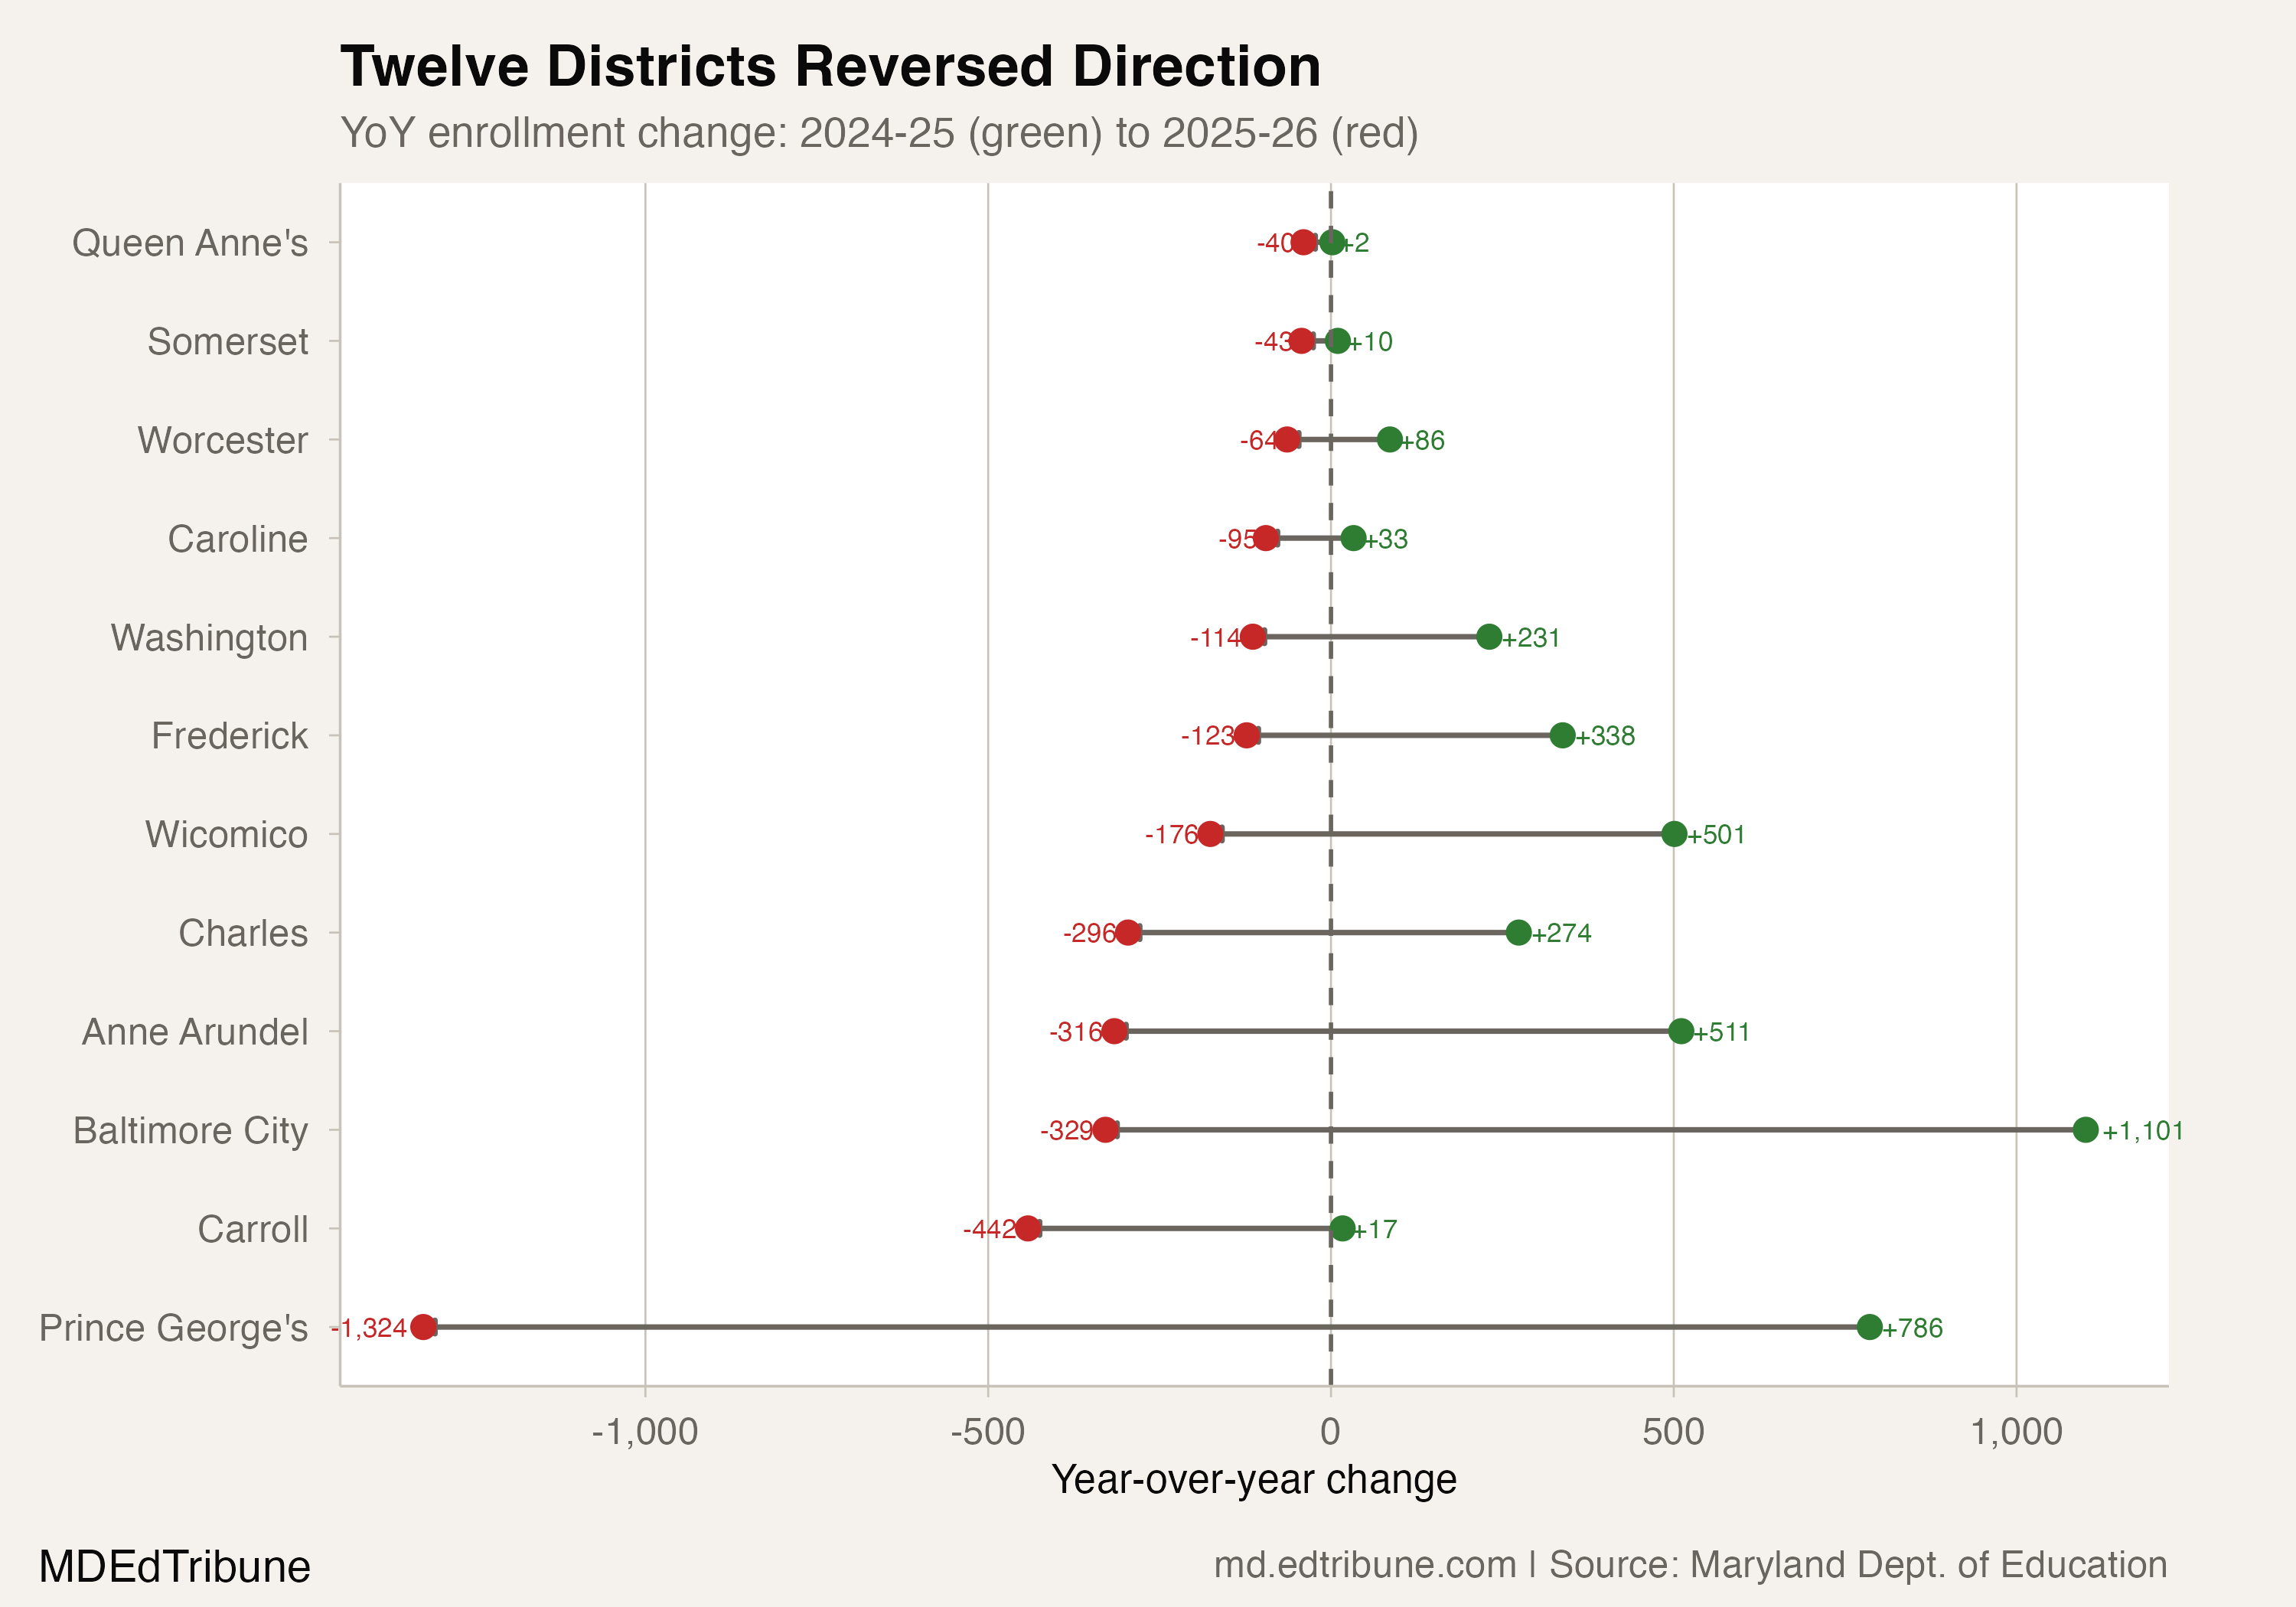
Prince George's County↗ET swung the hardest: from gaining 786 students to losing 1,324, a net reversal of 2,110 seats. Baltimore City↗ET went from adding 1,101 students, its largest single-year gain in the dataset, to losing 329. Frederick County↗ET, which had posted gains in eight of the last ten years, lost 123 students after gaining 338 the year before.
Several suburban and exurban districts that had been buoyed by post-pandemic rebounds also reversed. Anne Arundel↗ET went from +511 to -316. Charles County↗ET went from +274 to -296. Wicomico↗ET, on the Eastern Shore, swung from +501 to -176.
Even the smallest districts were not spared. Carroll County↗ET had the sharpest reversal by rate: a system that was essentially flat (+17) a year ago lost 442 students, a 1.7% decline. Caroline↗ET, Somerset↗ET, Worcester↗ET, and Queen Anne's↗ET all posted modest gains in 2024-25 and modest losses in 2025-26.
The worst since COVID
The statewide loss is the second-largest one-year decline in the dataset, exceeded only by the 18,291-student pandemic-year plunge in 2020-21. It erases four years of uneven recovery. After bottoming out at 853,307 in 2021-22, enrollment climbed back to 859,083 by 2024-25. The 2025-26 figure of 849,698 is now 3,609 students below that post-COVID low.
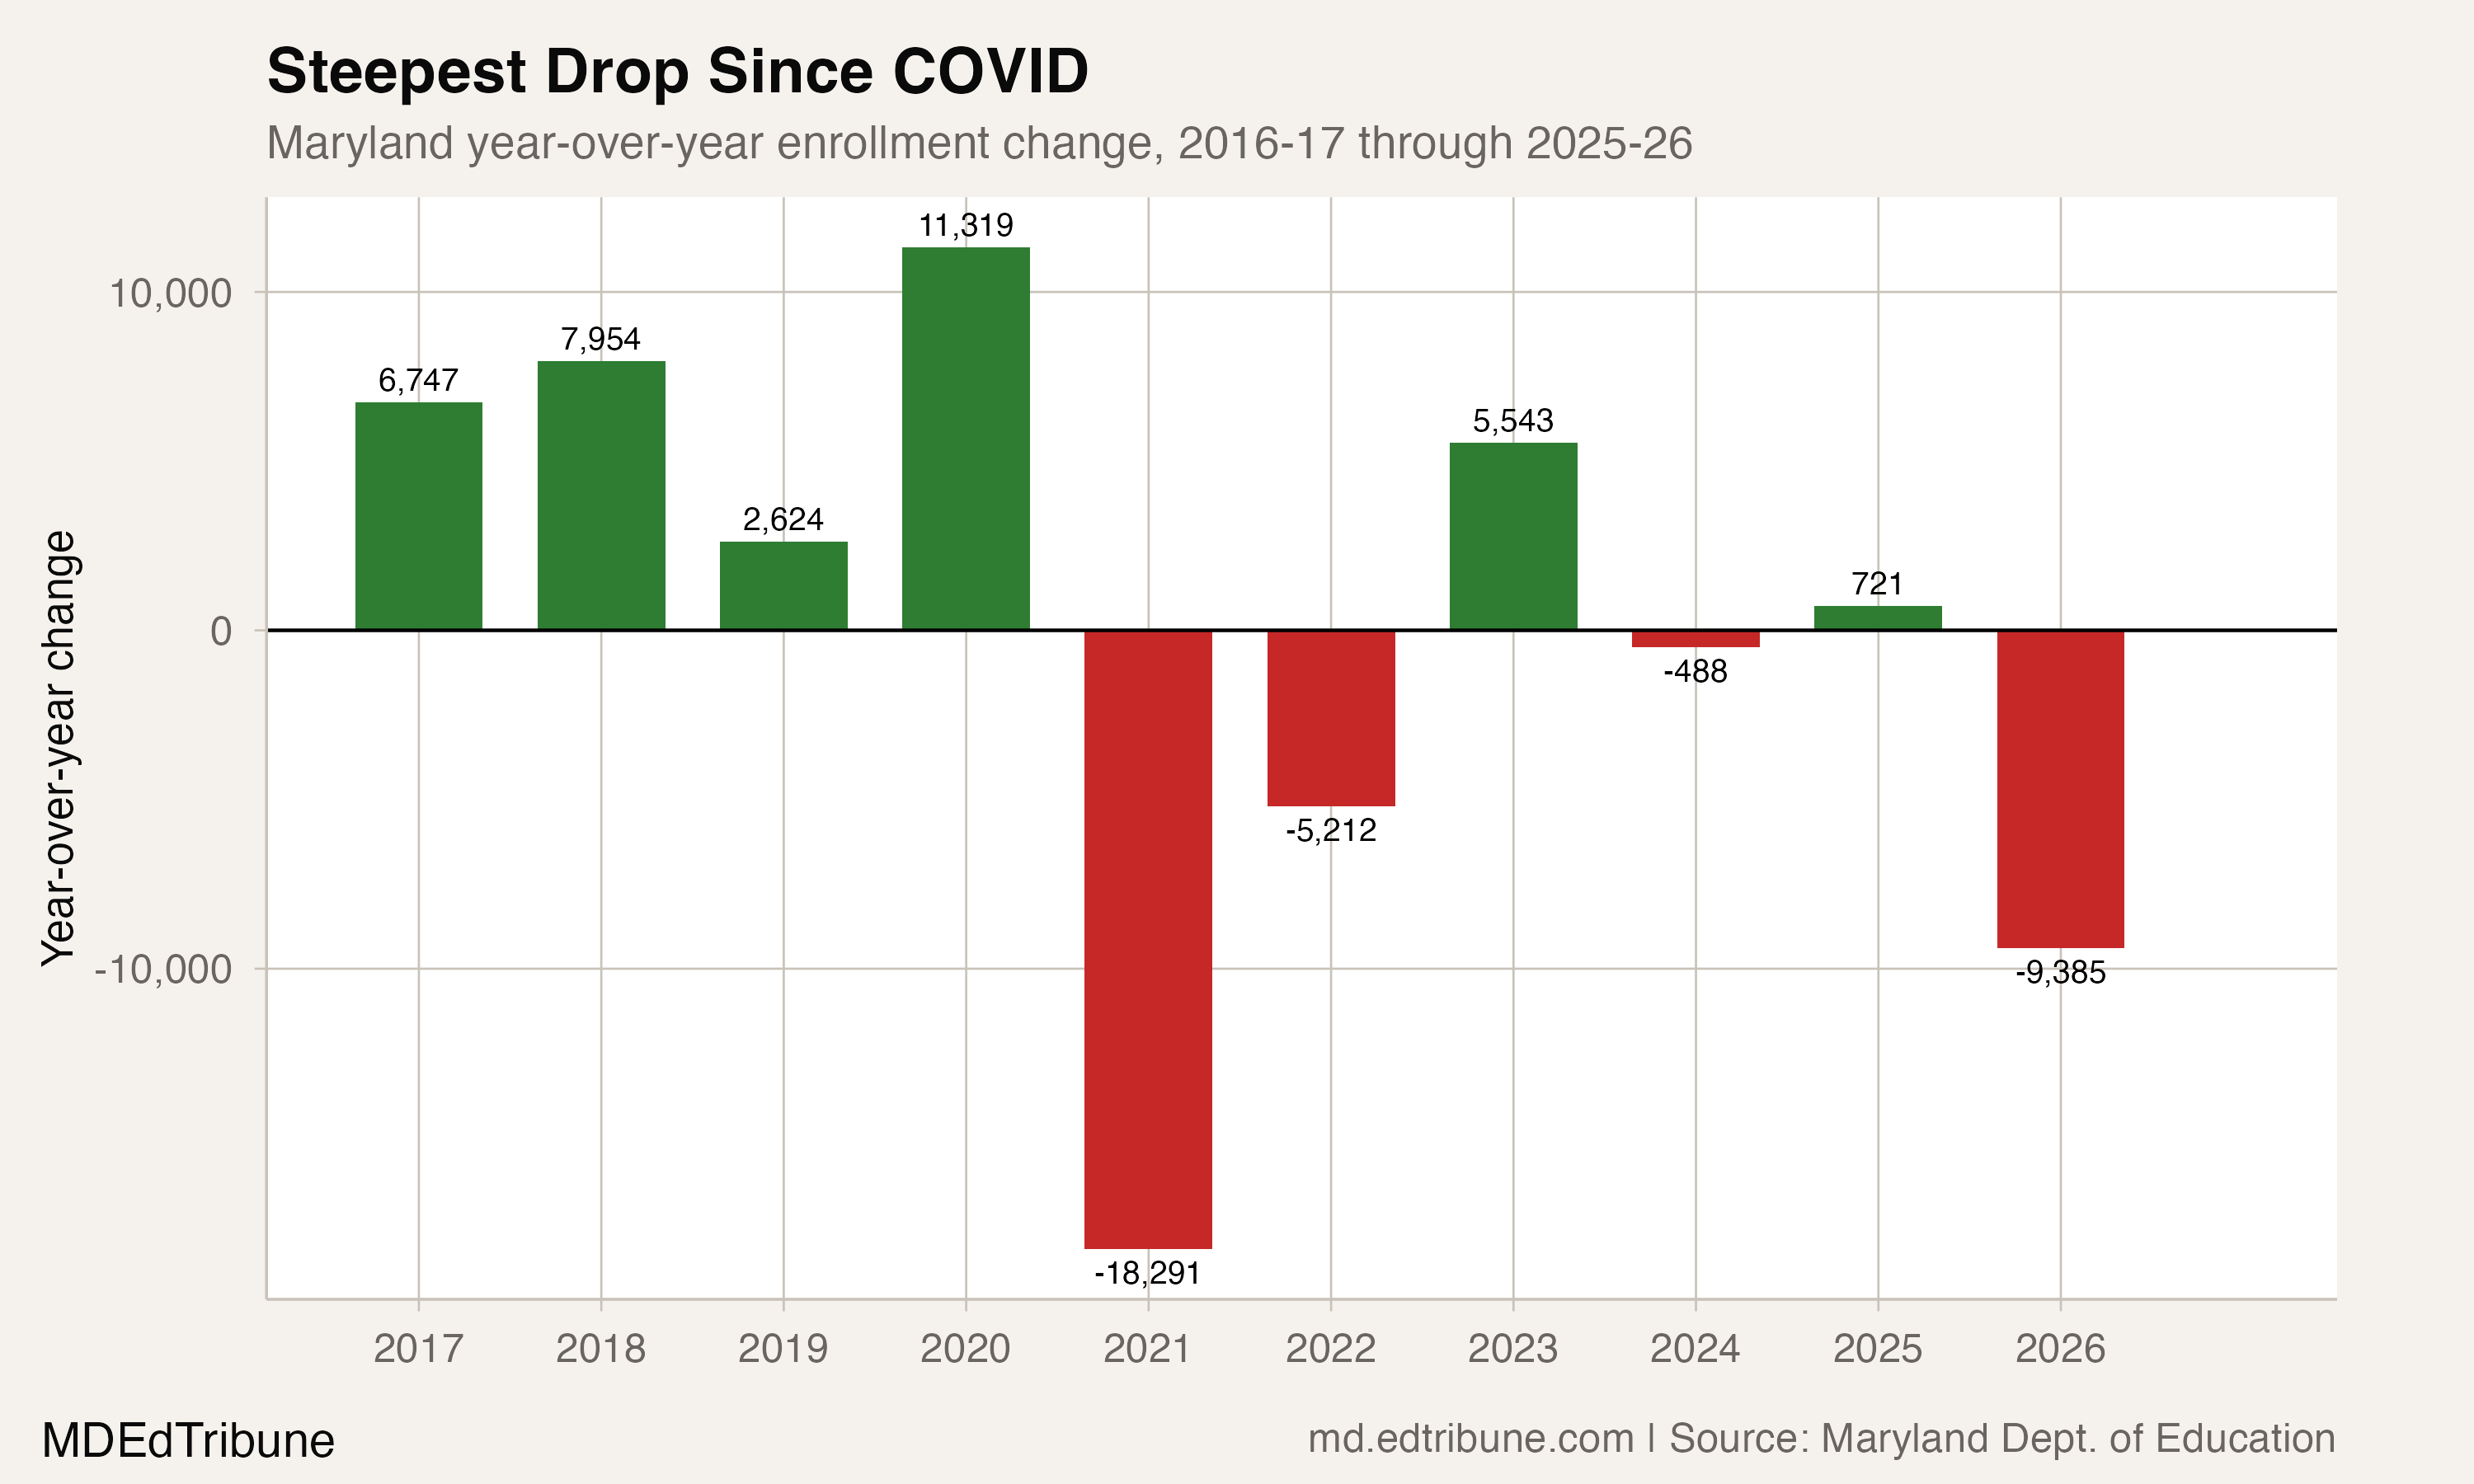
The decade-long trajectory shows how fragile the recovery was. Maryland reached 876,810 students in 2019-20, a pre-pandemic high. It has now lost 27,112 students from that peak, a 3.1% decline. The current enrollment of 849,698 sits just 1,532 above the 2015-16 level of 848,166.
Where the losses concentrated
Three districts account for more than half the statewide loss. Montgomery County↗ET, already declining, nearly tripled its losses: from -997 to nearly triple that figure, a 1.8% drop that left it at 151,983 students. Baltimore County↗ET went from -583 to -1,913, also 1.8%. Prince George's, as noted, swung from growth to a 1,324-student loss.
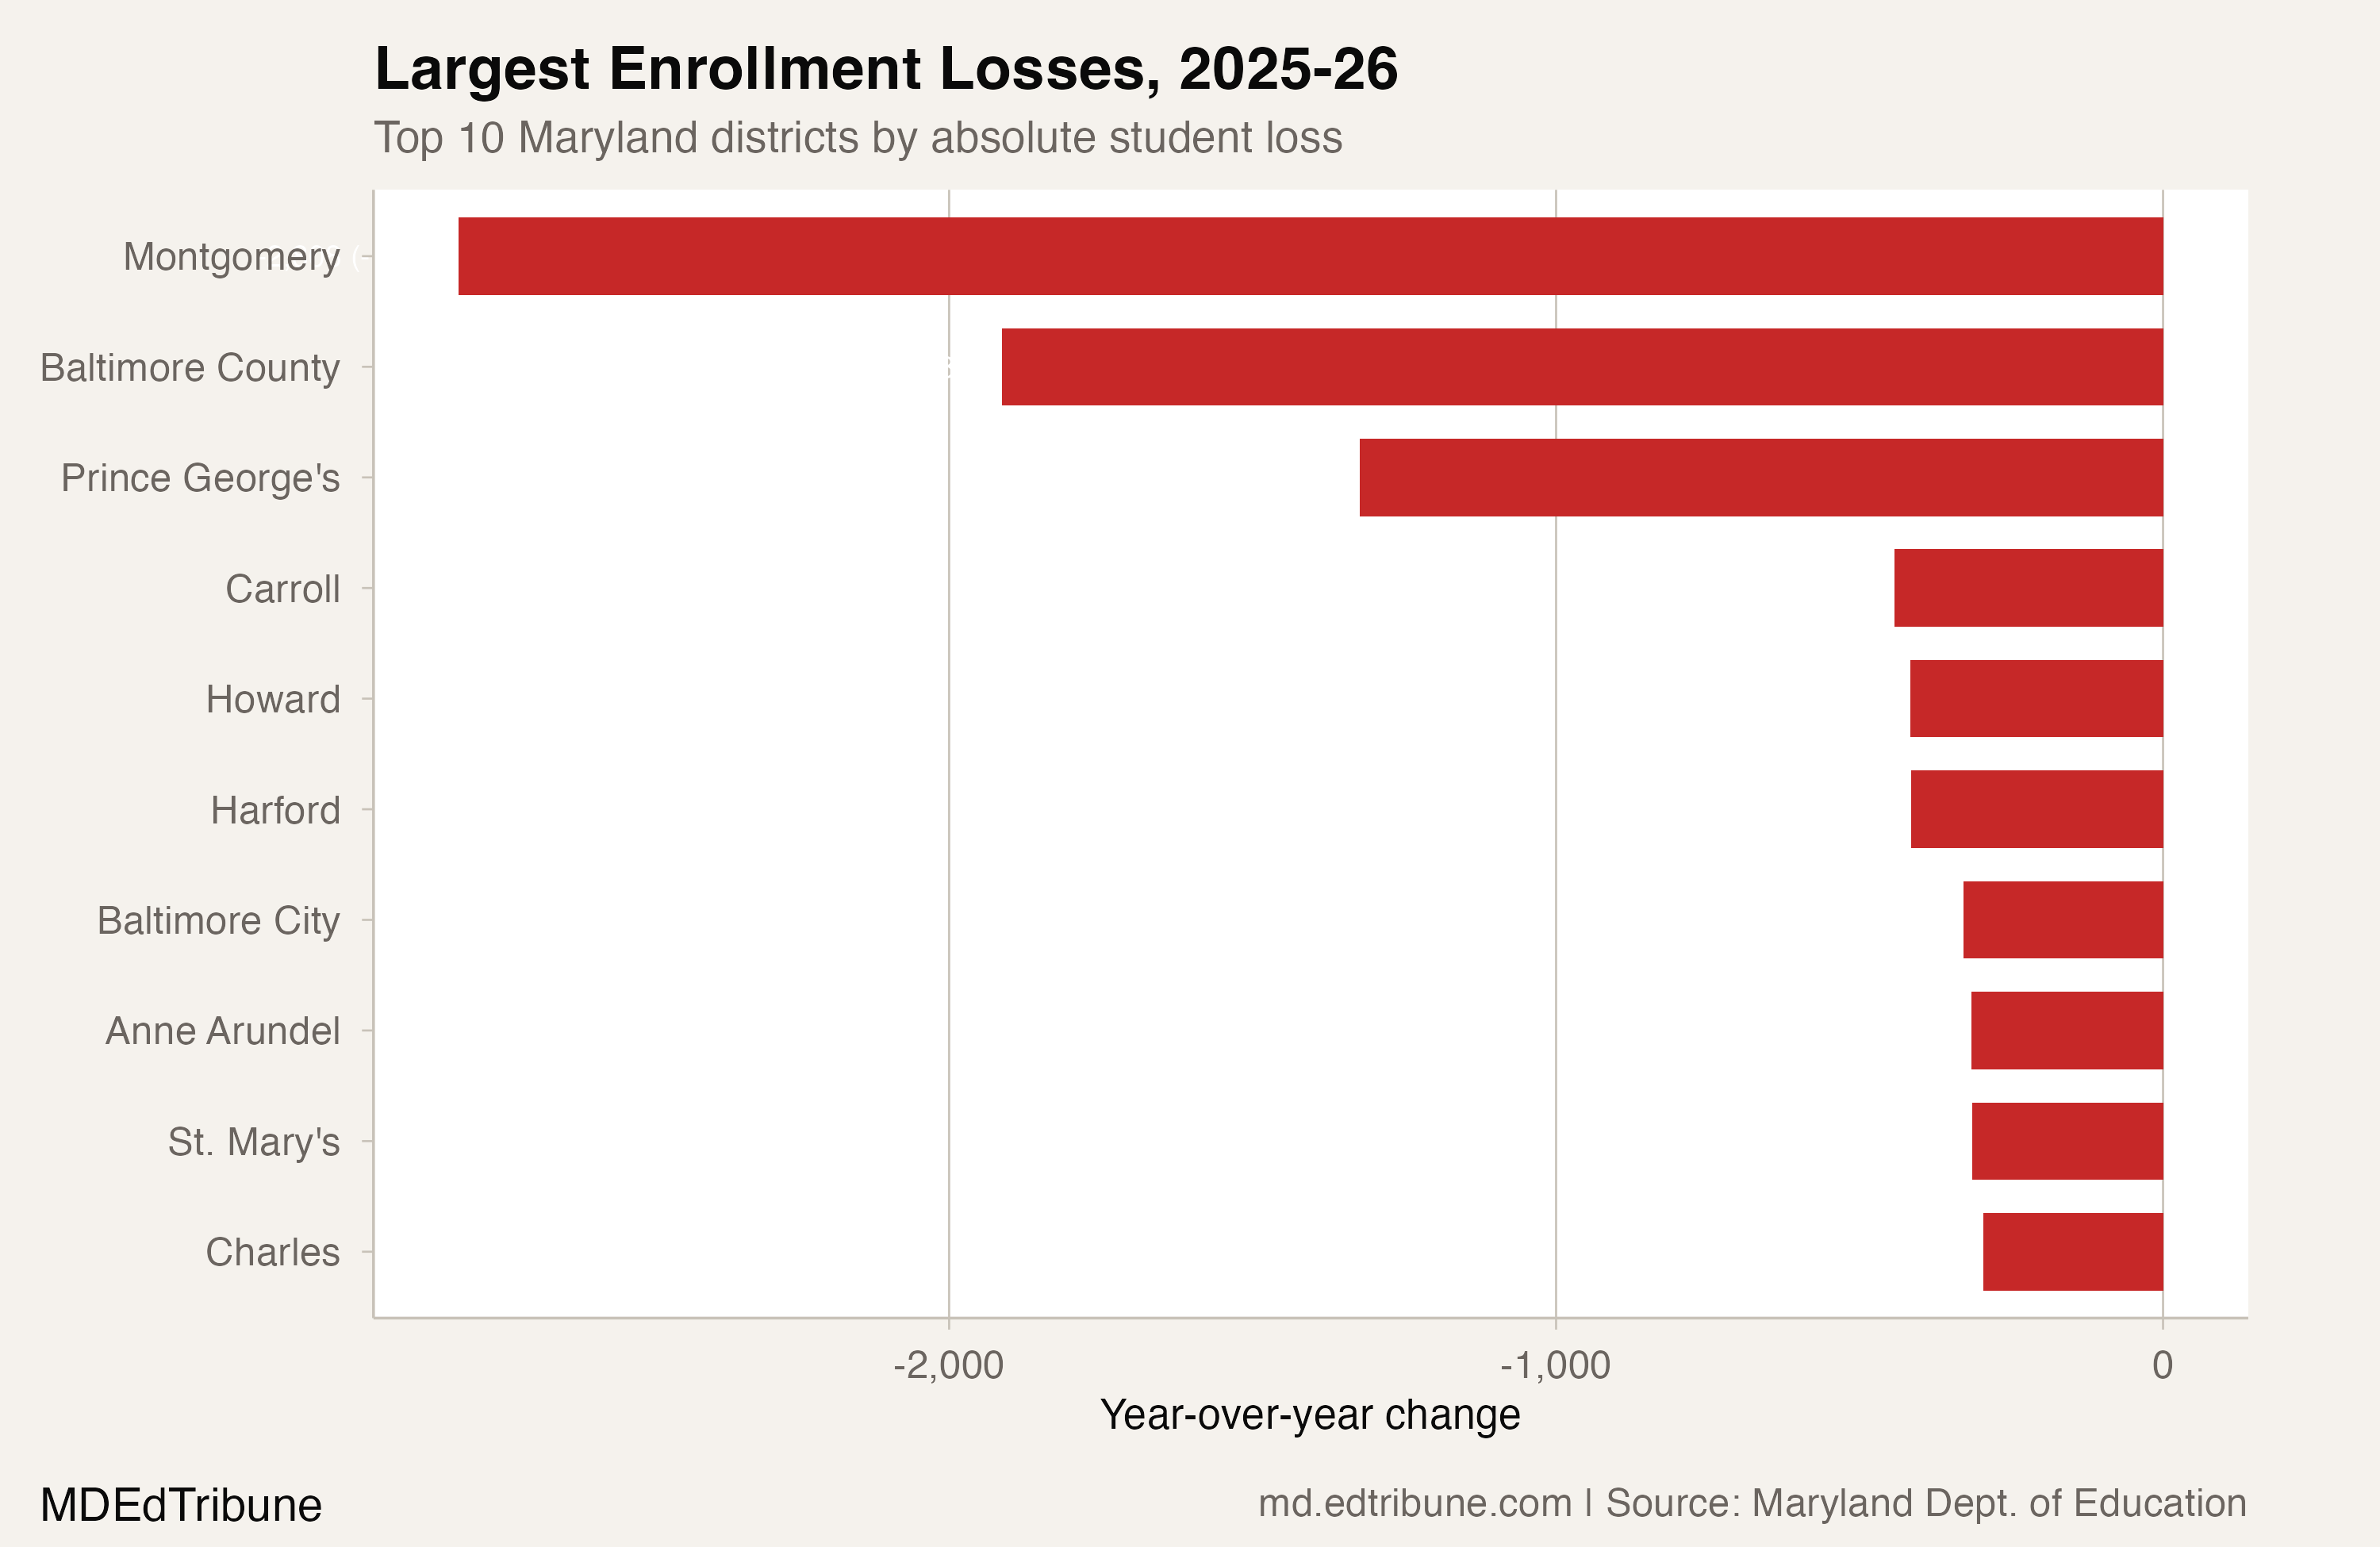
Montgomery's trajectory is particularly consequential. The state's largest school system projects losing nearly 7,000 additional students by 2032, a forecast driven by declining births in the county. MCPS Capital Budget Manager Donald Connelly told the school board that births in Montgomery County fell from more than 13,000 in 2014 to less than 11,000 in 2023.
Eleven districts hit all-time lows in the dataset (which begins in 2015-16): Allegany, Baltimore County, Calvert, Caroline, Cecil, Dorchester, Garrett, Harford, Montgomery, St. Mary's, and Talbot.
A convergence of pressures
The mass reversal does not appear to have a single cause. Multiple forces converged on 2025-26, and the data available, which covers only total enrollment and grade-level counts, cannot isolate their individual contributions.
The most widely cited factor is a structural one: declining birth rates. Maryland recorded roughly 70,000 births in 2019-20, compared with more than 77,000 in 2007-08. Those smaller cohorts are now entering elementary school while the larger ones graduate. The arithmetic is straightforward, but it has been true for years. What changed in 2025-26 was the layering of additional pressures on top of that baseline.
Immigration enforcement is one such pressure. Montgomery County Superintendent Thomas Taylor cited drops in international student enrollment, along with "skyrocketing housing costs" pushing families with young children out of the county. In October 2025, MCPS welcomed just over 100 newcomer students, fewer than half the 400-plus during the same period a year earlier. State Board of Education President Josh Michael told The Baltimore Banner: "Never has there been an administration in the era of mass public schooling where we have treated immigrants this way."
"Never has there been an administration in the era of mass public schooling where we have treated immigrants this way." — Josh Michael, President, Maryland State Board of Education, The Baltimore Banner
That dynamic is most visible in Prince George's and Montgomery counties, which together are home to more than half of Maryland's foreign-born population. The two districts combined lost 4,132 students in 2025-26. But immigration enforcement cannot explain the reversal in Carroll County, Washington County, or the Eastern Shore districts, where immigrant populations are much smaller.
Federal employment losses add another layer. Maryland is losing federal jobs faster than any other state as the administration cuts positions, potentially forcing families to relocate. Homeschooling has also surged: Maryland now has roughly 42,000 homeschooled children, up 51% from 28,000 in 2020.
The enrollment data cannot distinguish between families who left the state, switched to private or homeschool, or simply never enrolled a kindergartner. It captures the outcome but not the mechanism.
From split to nearly unanimous
The direction chart tells the clearest version of the story. Pre-pandemic, Maryland routinely had 14 to 17 districts growing each year. Even in the recovery years of 2022 and 2023, seven and 16 districts, respectively, posted gains. The 2025-26 result, with a single district in positive territory, matches the near-unanimity of the pandemic year itself, when only two districts grew.
The difference is that COVID was an acute shock with a visible cause. The 2025-26 reversal is not a single event but a slow-moving convergence: fewer births, fewer newcomers, fewer federal paychecks, more families choosing alternatives to public school. Each force is individually modest. Together, they produced the most geographically uniform decline in a decade.
The funding question
Under the Blueprint for Maryland's Future, school funding flows through a per-pupil formula that uses the greater of prior-year enrollment or a three-year moving average. That buffer was designed for temporary dips, not a statewide reversal. If 2026-27 enrollment continues to decline, the moving average will catch up, and districts will face funding reductions proportional to their losses.
Montgomery County's accelerating losses, on top of prior-year losses, will compress that buffer quickly. For Prince George's, which had been growing, the sudden reversal means 2025-26 funding was calibrated for a district that no longer exists at that size.
The question facing Maryland's school systems is not whether to plan for smaller enrollment. The question is whether the 2025-26 reversal was a one-year convergence of unusual pressures, or the beginning of a structural shift in which growth districts no longer exist. The answer depends on factors, from federal immigration policy to interest rates to birth registrations, that no superintendent controls.
Detailed code that reproduces the analysis and figures in this article is available exclusively to EdTribune subscribers.
Discussion
Sign in to join the discussion.
Loading comments...