Correction (Sept. 26, 2026): An earlier version used a historical series that the current Maryland data package does not publish, misstated the size of the annual improvements and treated a mechanical projection as evidence about a pre-COVID baseline. This version limits the analysis to the current official series and labels projections as arithmetic scenarios.
This is part of The MDEdTribune's series on Maryland's chronic absenteeism data.
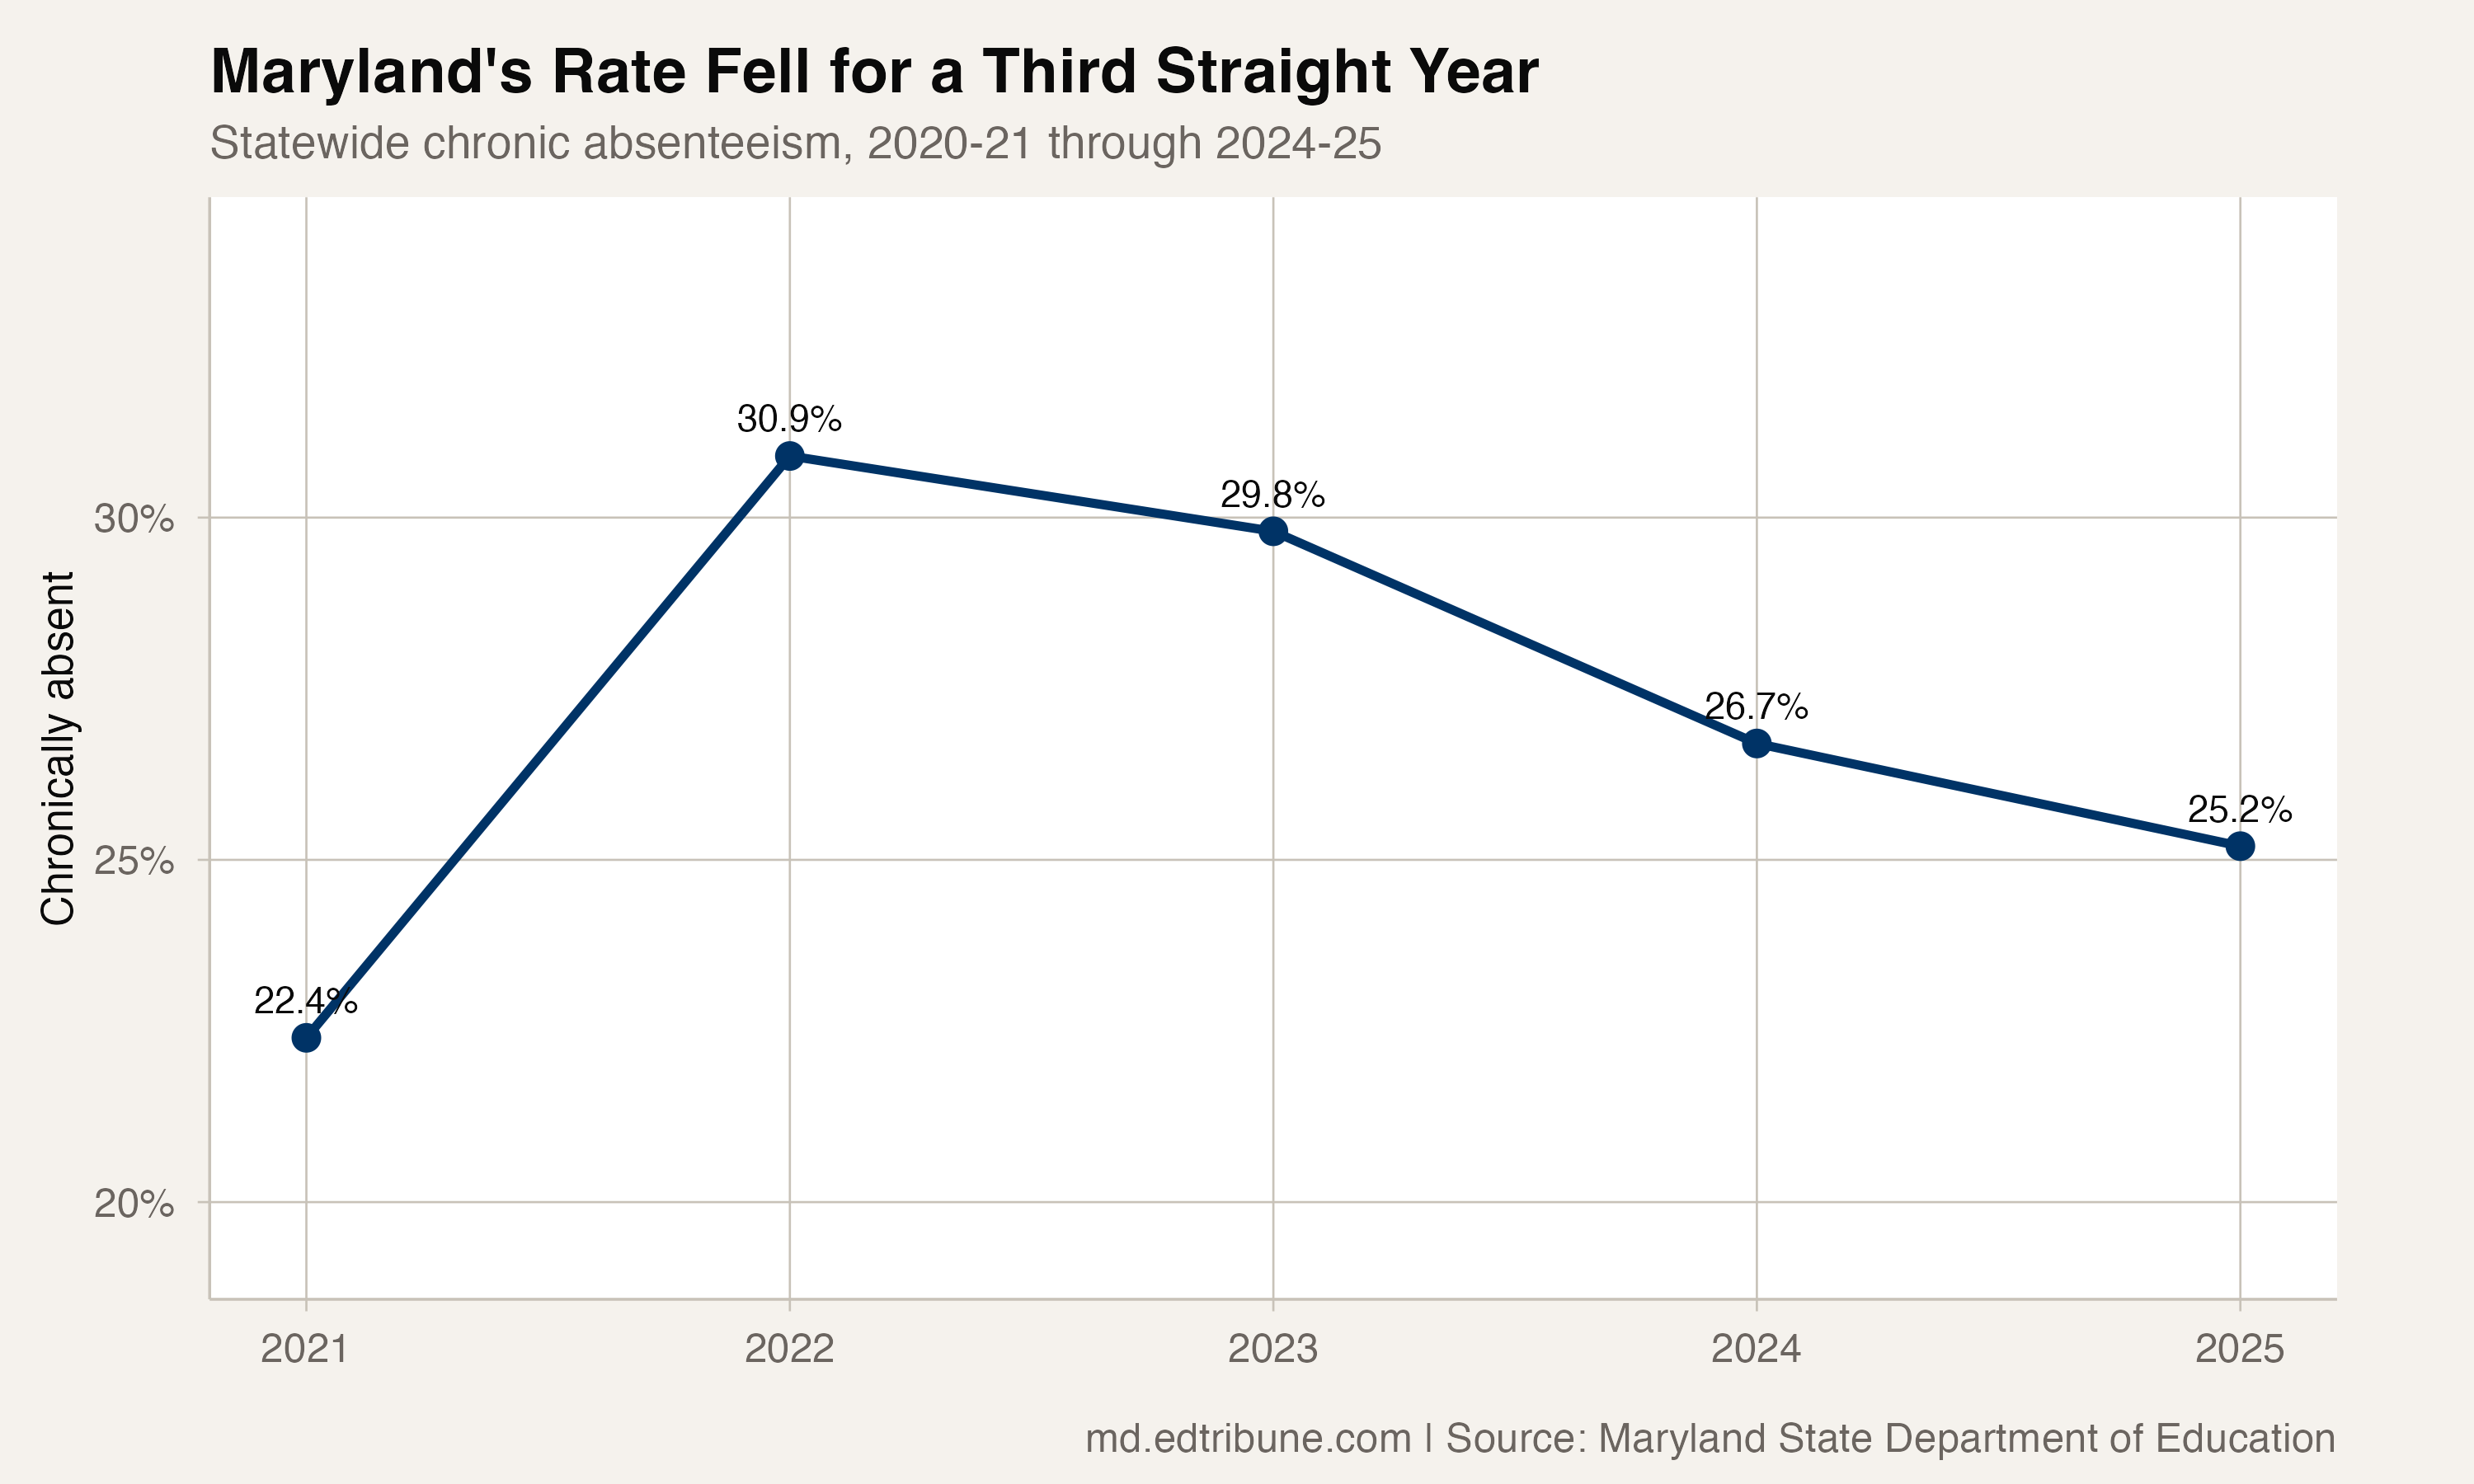
Maryland's chronic absenteeism rate fell to 25.2% in 2024-25, the most recent school year published in the state data package. That was the third consecutive improvement after the rate peaked at 30.9% in 2021-22.
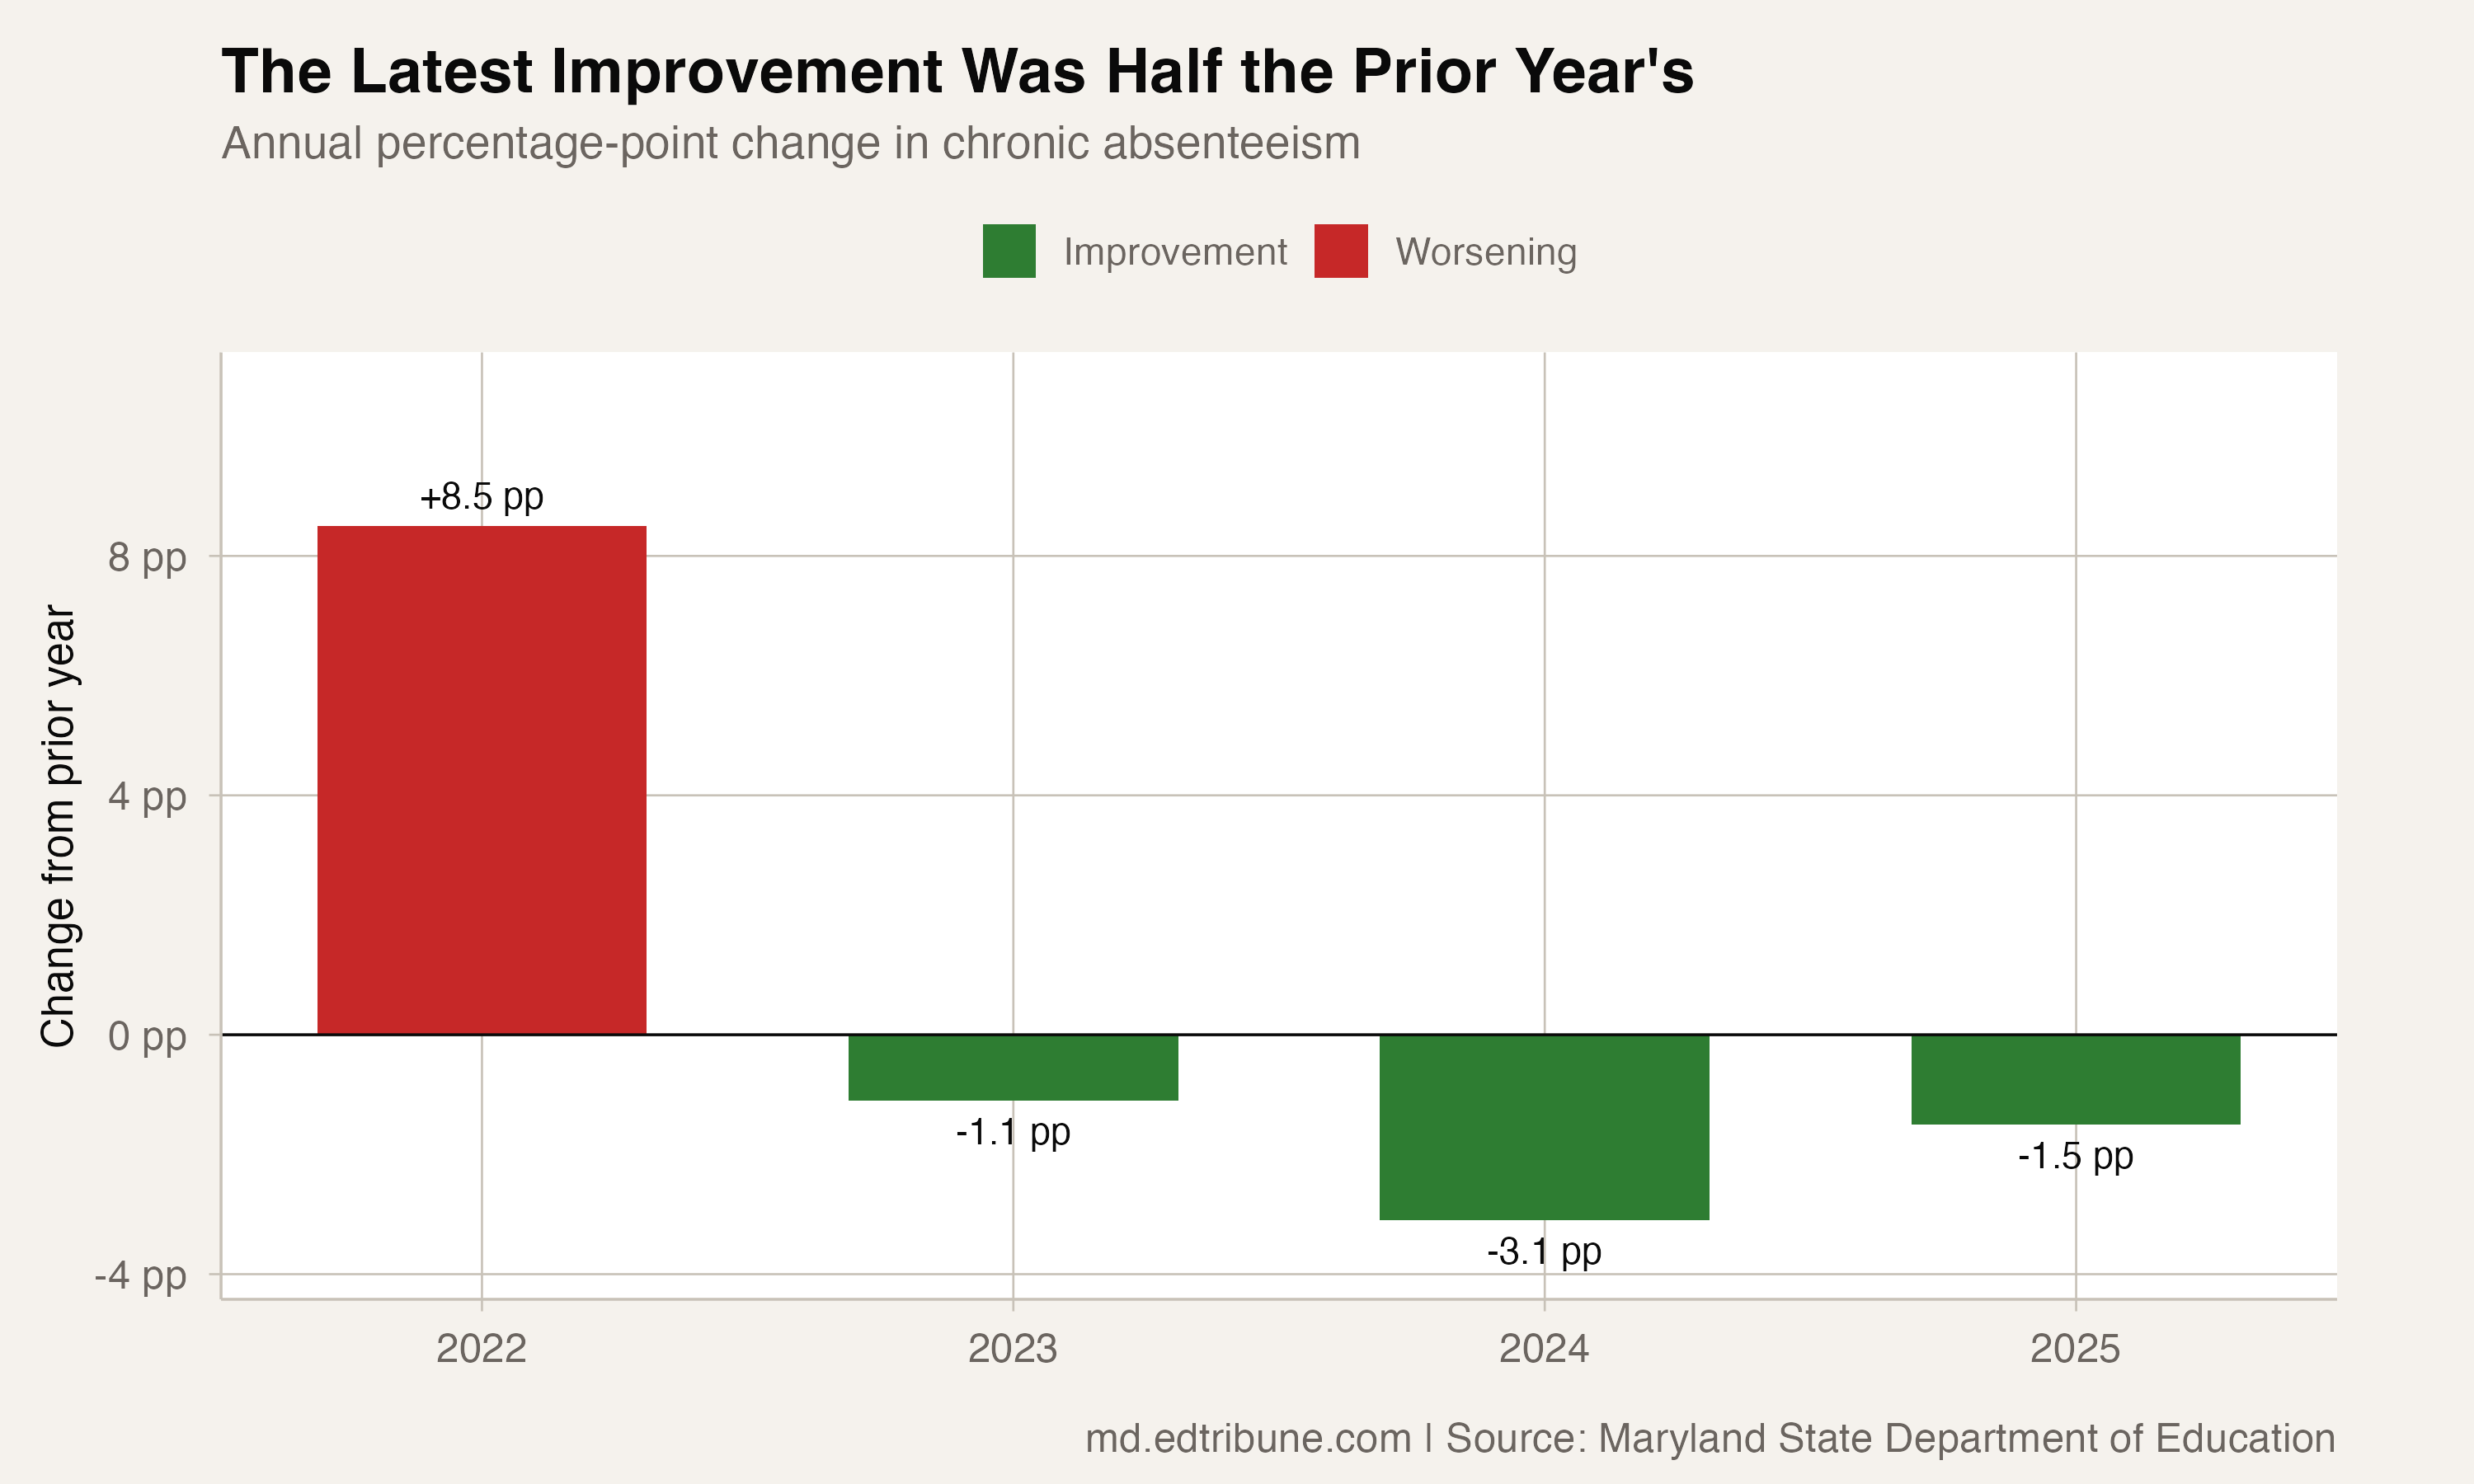
The latest step was smaller. The rate fell 3.1 percentage points in 2023-24, then 1.5 points in 2024-25. The second decline was 1.6 points smaller and 48.4% as large as the first.
Three improvements, not a straight-line recovery
The published statewide series begins in 2020-21 at 22.4%. It rose 8.5 points to 30.9% in 2021-22, then declined to 29.8%, 26.7% and 25.2% over the next three school years.
Those annual improvements were 1.1, 3.1 and 1.5 points. The latest result supports a narrow conclusion: improvement slowed from the prior year. It does not establish a plateau or a continuing deceleration pattern, because the first recovery step was smaller than the latest one.
The rate has fallen 5.7 points from the peak but remains 2.8 points above the 2020-21 figure. That first observation is for 2020-21, so it is not a pre-COVID baseline. The current package contains no pre-COVID statewide chronic-absence years and cannot establish the earlier worsening streak claimed in the previous version.
The target year is ahead of the published data
The Accountability and Implementation Board and Maryland State Board of Education set a 15% chronic-absence target for 2025-26. The most recent published rate, from 2024-25, was 10.2 points above that target.
The target school year has ended, but the package does not yet include its result. The 2024-25 figure therefore cannot show whether Maryland met or missed the 2025-26 target. It does show the scale of the required one-year change: a 10.2-point decline would be about 3.3 times the largest annual improvement in the available post-peak series.
Maryland's current definition counts students expected to attend for at least 10 days who miss at least 10% of their school days.
The statewide 2024-25 row covers 882,012 students in that measure; 222,674 were reported chronically absent. That count was 13,975 lower than in 2023-24, while the measure population also changed between years.
Two arithmetic scenarios, neither a forecast
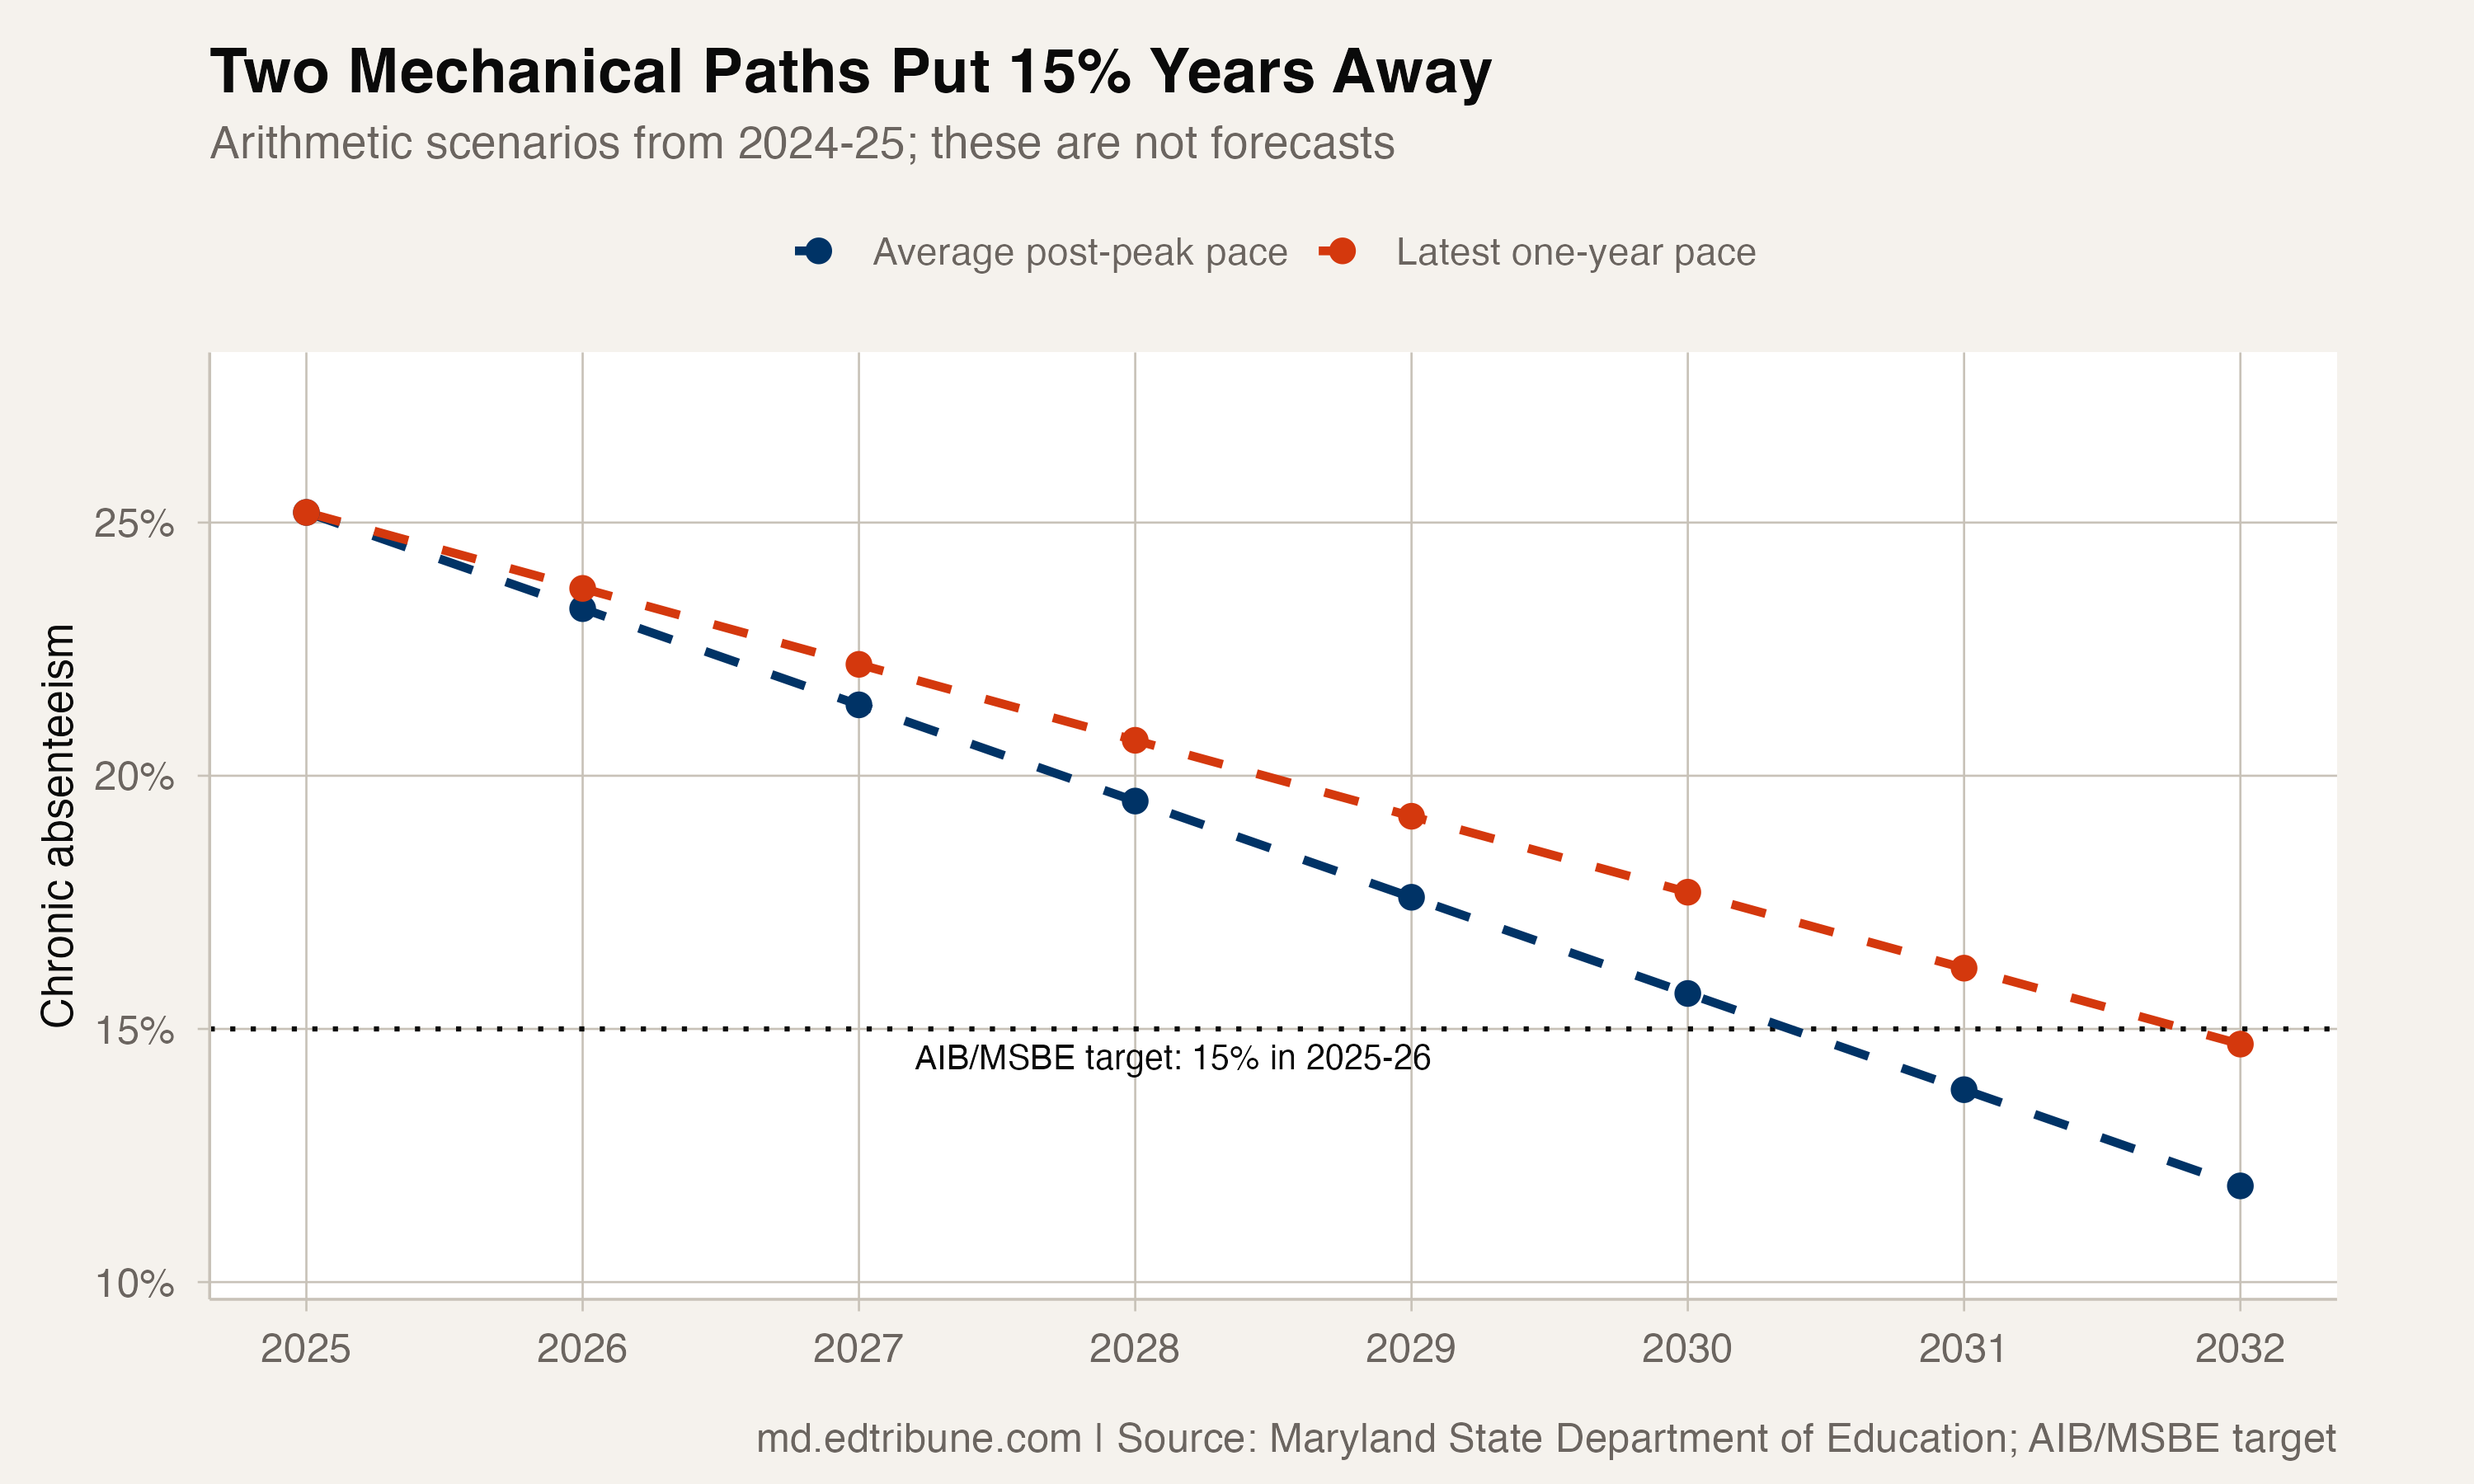
If the average post-peak improvement of 1.9 points per year continued unchanged, a simple annual sequence would first fall below the 15% target in 2030-31. If only the latest 1.5-point pace continued, it would first cross the line in 2031-32.
Those lines are mechanical scenarios, not forecasts. They assume the same number of percentage points disappears every year and do not model policy, attendance behavior, enrollment changes or any other cause. The aggregate file cannot say why the rate moved, and one slower year cannot say what happens next.
The verified finding is less dramatic than the previous pre-COVID narrative but more useful. Maryland has recorded three straight improvements and remains well below the 2021-22 peak. The latest improvement was also less than half the prior year's. Whether that is a pause, a new pace or ordinary year-to-year variation will require the 2025-26 result.
Data source: Maryland State Department of Education Report Card. Analysis covers the published statewide all-student chronic-absence series for 2020-21 through 2024-25.
Detailed code that reproduces the analysis and figures in this article is available exclusively to EdTribune subscribers.
Discussion
Sign in to join the discussion.
Loading comments...