This is part of The MDEdTribune's series on Maryland's chronic absenteeism data.
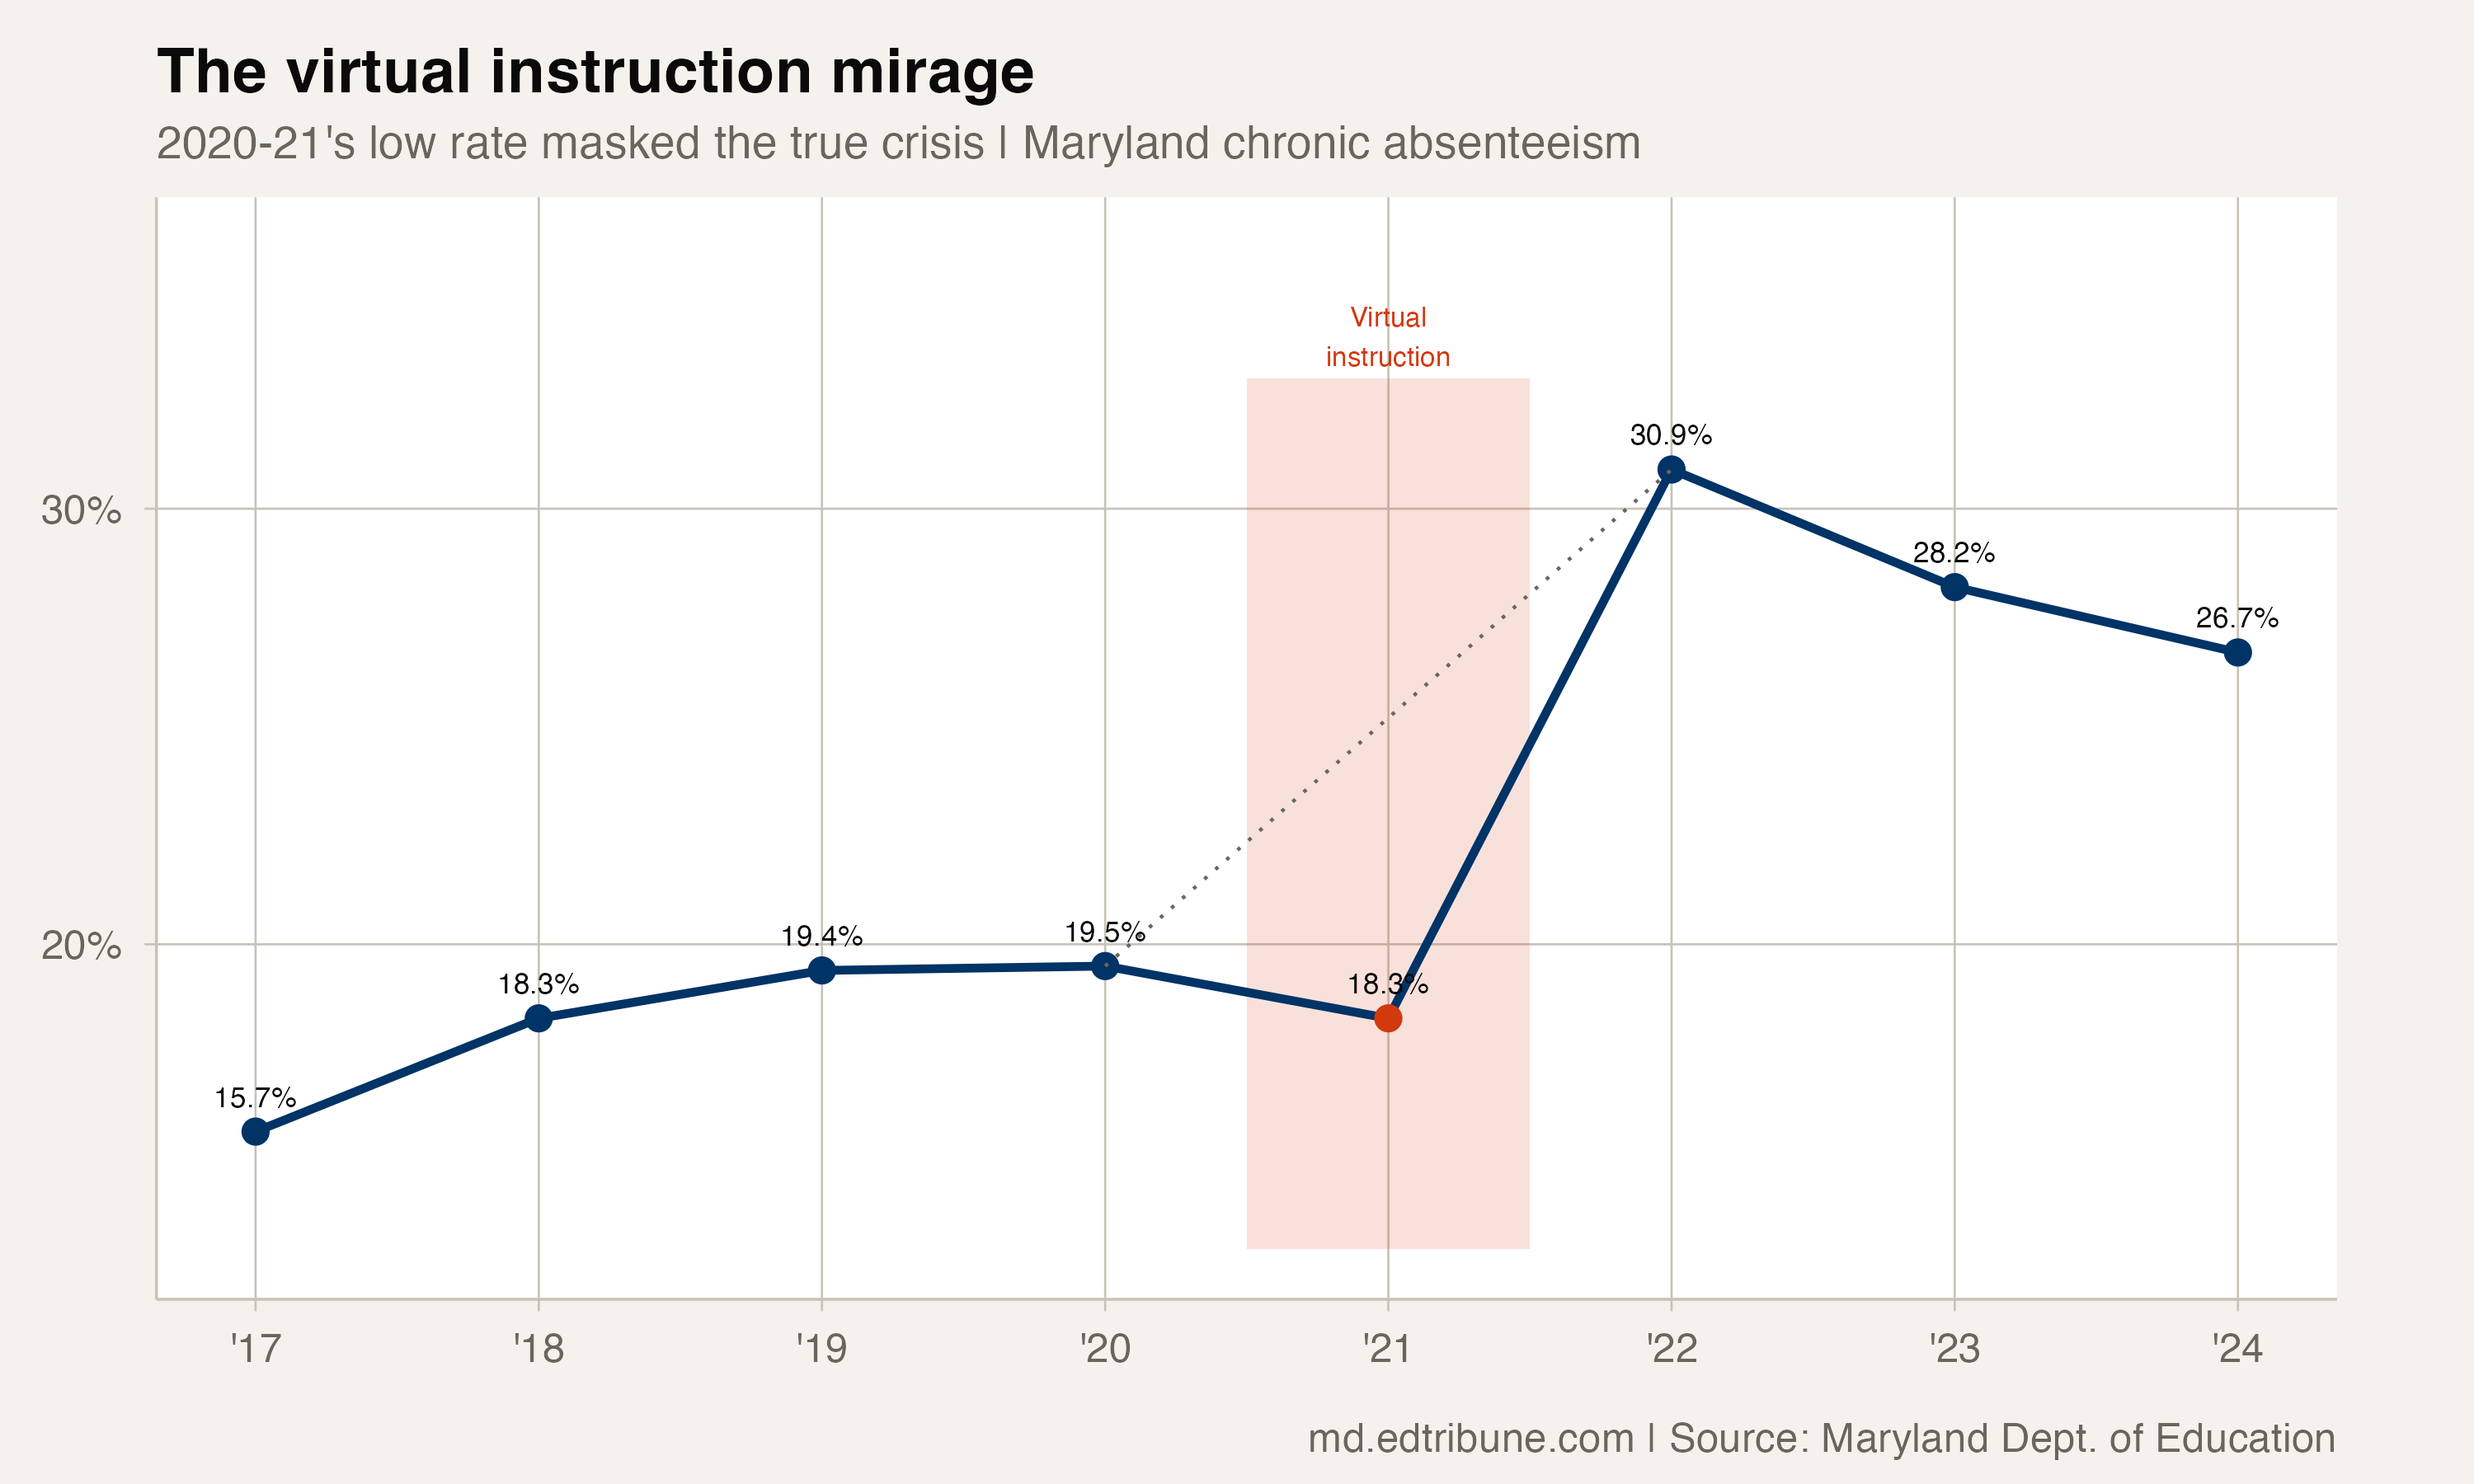
In 2020-21, with most Maryland schools operating virtually, the state's chronic absenteeism rate dropped to 18.3%. It was the lowest rate since 2016-17 and appeared to show that the pandemic, somehow, had not worsened attendance. The number made its way into reports and trend lines as evidence of resilience.
It was evidence of nothing. Students were logging into video calls from their beds. The attendance system was counting them as present.
When Maryland schools returned to in-person instruction for the 2021-22 school year, the chronic absenteeism rate did not resume where it had left off in 2019-20, when it was 19.5%. It leaped to 30.9%, a 12.6 percentage-point spike that dwarfed every other year-over-year change in the data by a factor of nearly five.
What the virtual year actually measured
Maryland, like most states, defines chronic absenteeism as missing 10% or more of enrolled school days. During virtual instruction, a "day of school" meant appearing on a screen. The threshold for what counted as attendance was fundamentally different from the in-person standard that produced every other data point in the series.
This is not a question of whether students were learning during virtual instruction. It is a question of measurement. The 18.3% rate and the rates on either side of it (19.5% in 2020 and 30.9% in 2022) are not measuring the same thing. A student who never left their bedroom but logged into a Google Meet was, by the metric, attending school. A student who showed up to the building but missed 19 days was chronically absent.
The 2020-21 data point does not sit on the same continuum as the rest of the series. It is an artifact of a measurement system designed for in-person schooling that was applied, without adjustment, to a fundamentally different mode of education.
The 12.6-point spike was not a spike
The framing matters. The standard narrative calls 2021-22 a "spike" or an "explosion" in chronic absenteeism. That implies something changed abruptly in student behavior. What changed abruptly was the measurement environment: students had to physically appear at a building, and the number who could not or did not was much larger than the pre-pandemic figure.
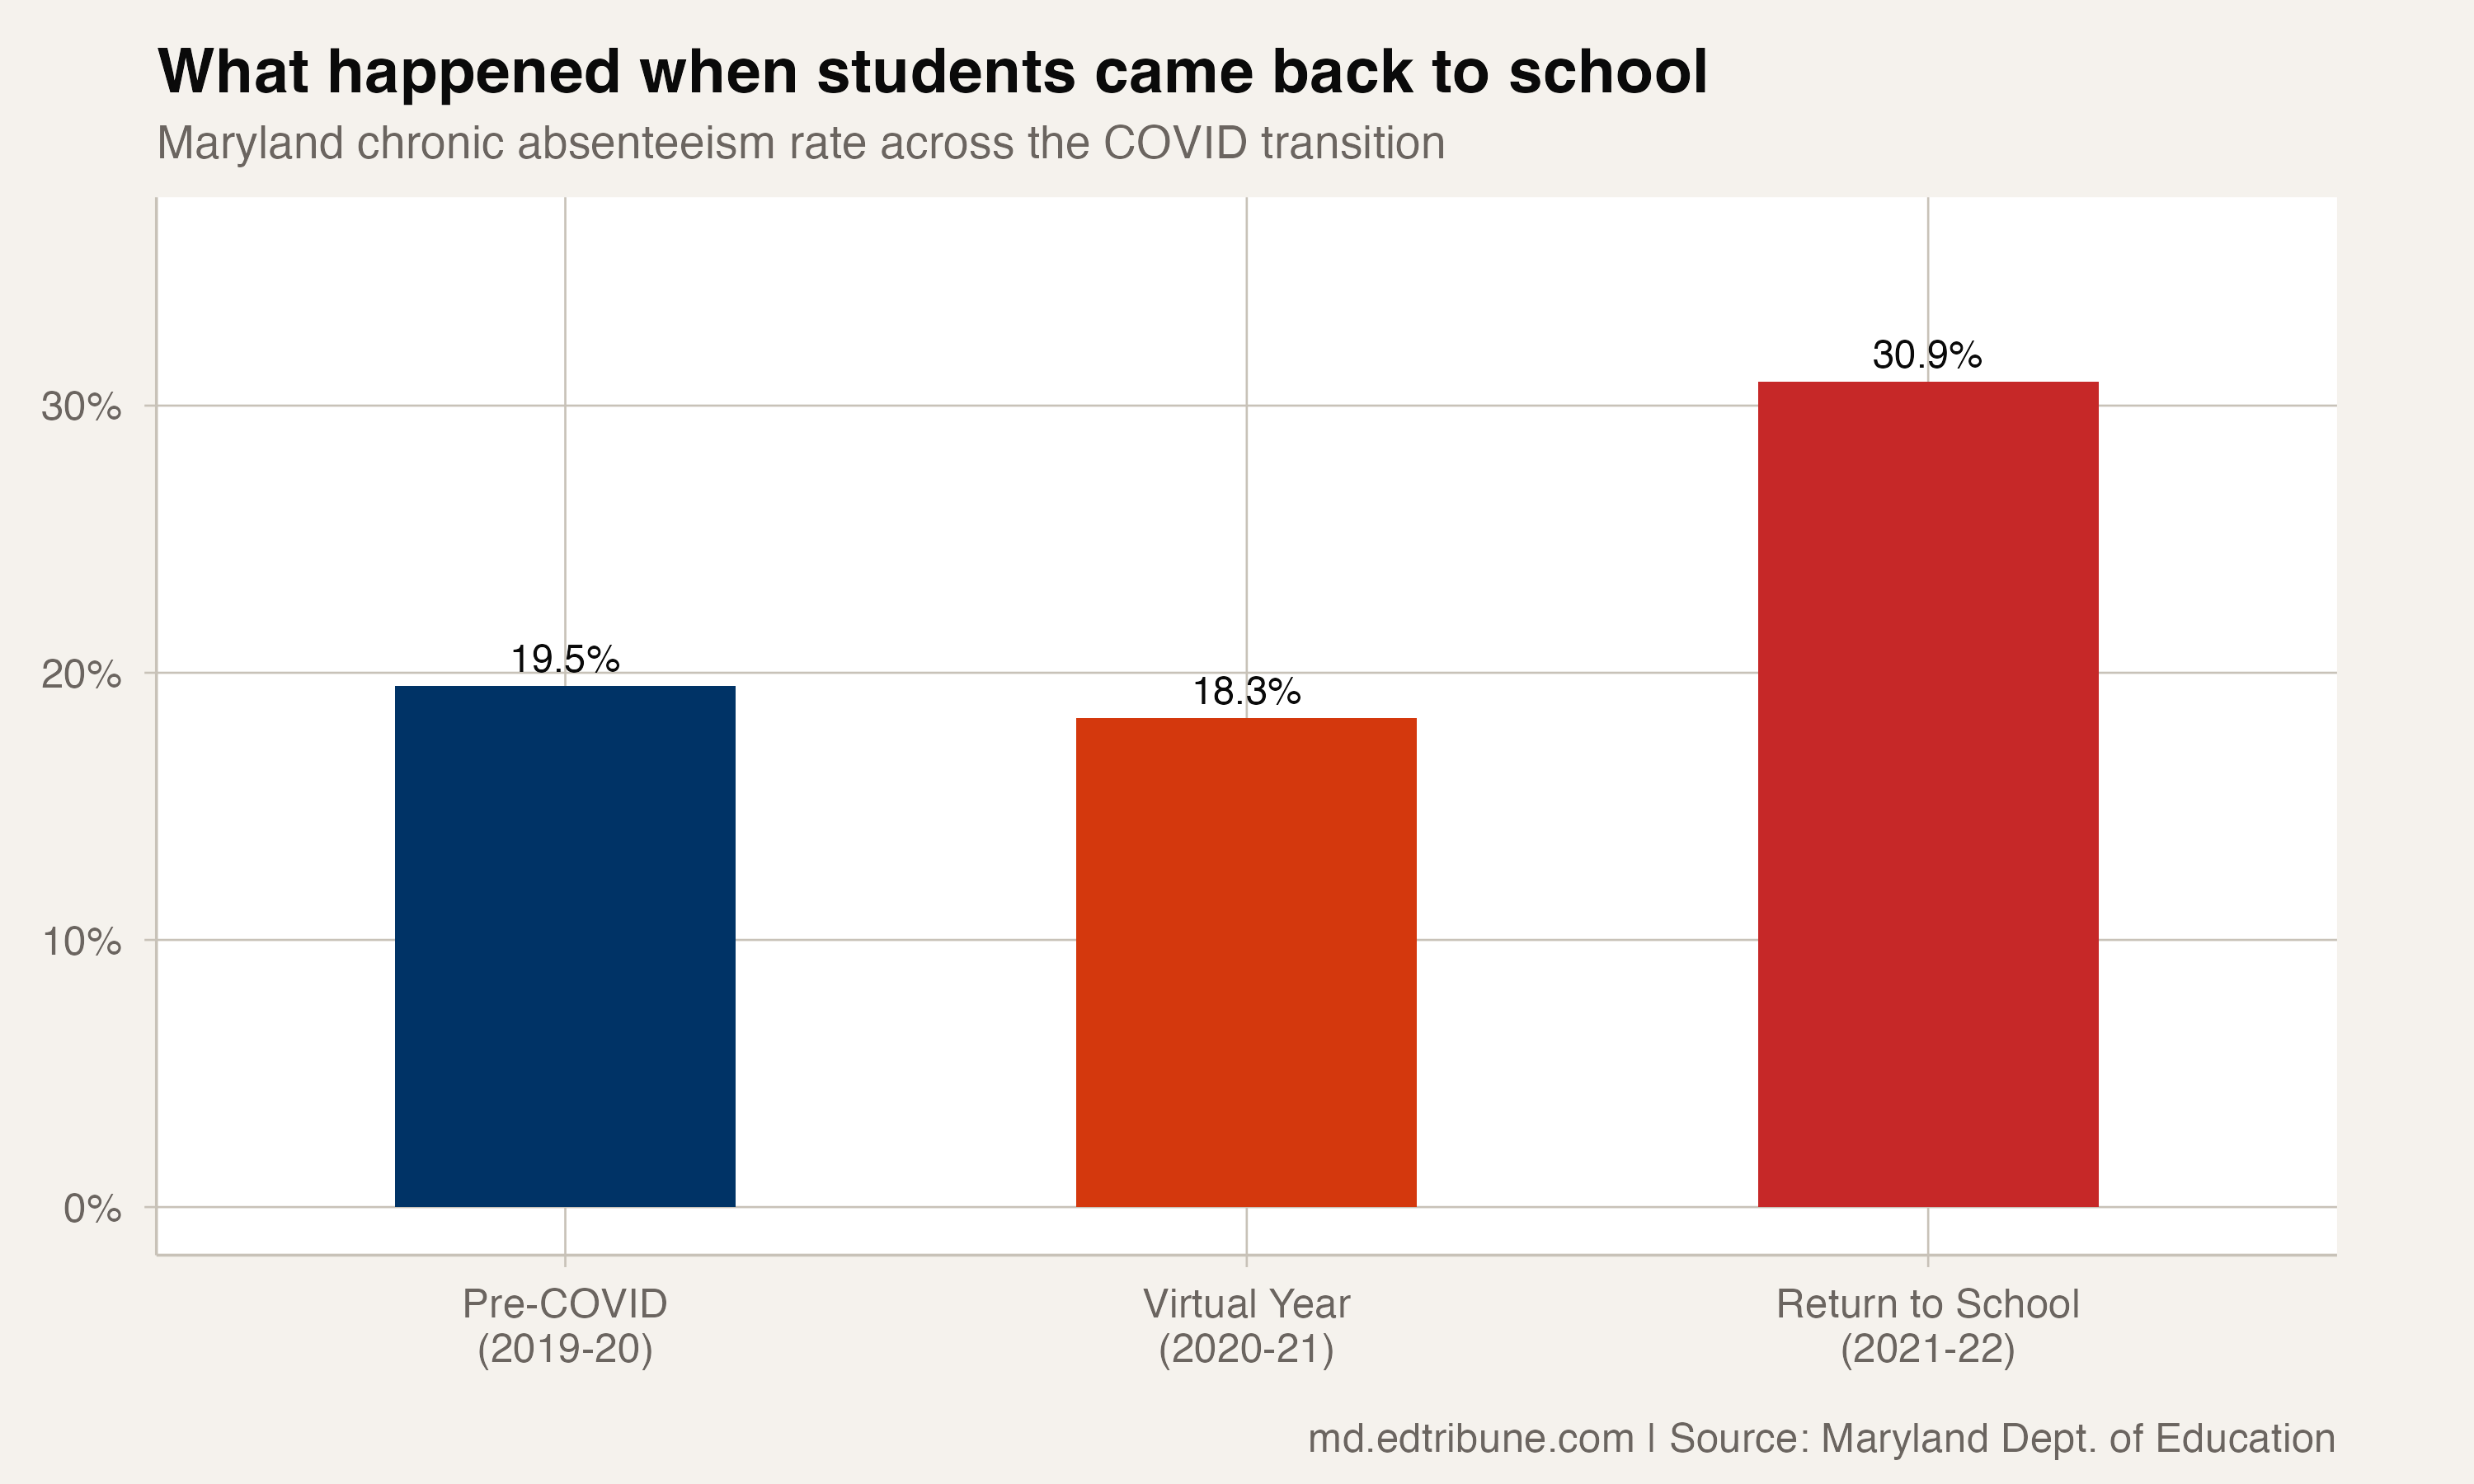
Some of the 30.9% rate was genuine pandemic fallout: families who had disengaged from school, students who had developed mental health challenges, communities where transportation and child care infrastructure had not fully returned. But some portion of it represents students who were effectively absent during virtual instruction but not counted as such. The 2021-22 rate did not create new chronic absenteeism. It revealed absenteeism that the virtual attendance system had rendered invisible.
What this means for the trend line
Maryland's nine-year chronic absenteeism trend is typically drawn as a line from 15.7% in 2017 through the 2022 peak to 25.0% in 2025. That line passes through 18.3% in 2021 and the resulting shape, a dip followed by a surge, suggests a single, dramatic COVID event.
A more honest reading skips the 2021 data point entirely. The trajectory from 2020 (19.5%) to 2022 (30.9%) represents what happened when the pandemic's full effect on attendance became measurable. The 2021 number is a parenthetical, not a data point.
This interpretation changes the recovery math. If the baseline for measuring pandemic damage is 2020's 19.5% rather than 2021's 18.3%, the peak-to-present improvement from 30.9% to 25.0% has covered 5.9 of 11.4 excess points, or 51.8%. If the baseline is the pre-worsening 2017 rate of 15.7%, the improvement has covered 5.9 of 15.2 excess points, or 38.8%.
Either way, the virtual year's 18.3% does not represent a state that had its attendance under control. It represents a state that had temporarily stopped measuring.
Detailed code that reproduces the analysis and figures in this article is available exclusively to EdTribune subscribers.
Discussion
Sign in to join the discussion.
Loading comments...